Going online and monitoring the running program is the single most
valuable maintenance skill in TIA Portal — it lets you watch the
machine’s logic actually execute, seeing which conditions are true and
false in real time. This is how you understand what a running machine is
doing and diagnose why it is not doing what it should. Because
monitoring changes nothing, you can do it freely, and this chapter shows
how to go online safely and read the live program.
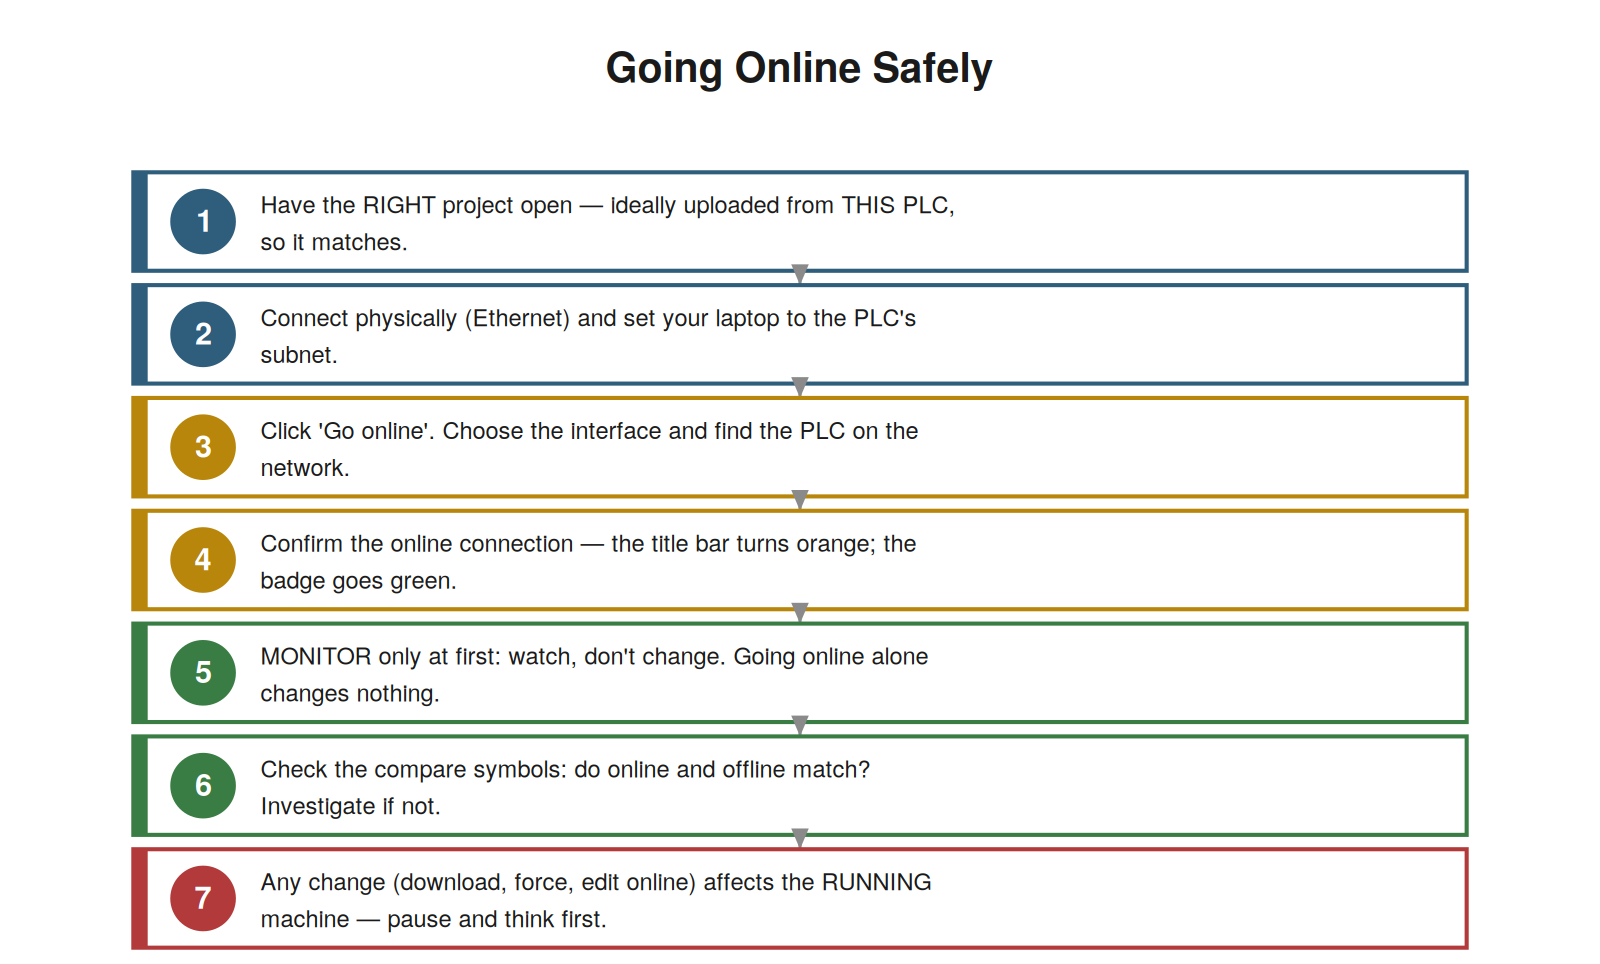
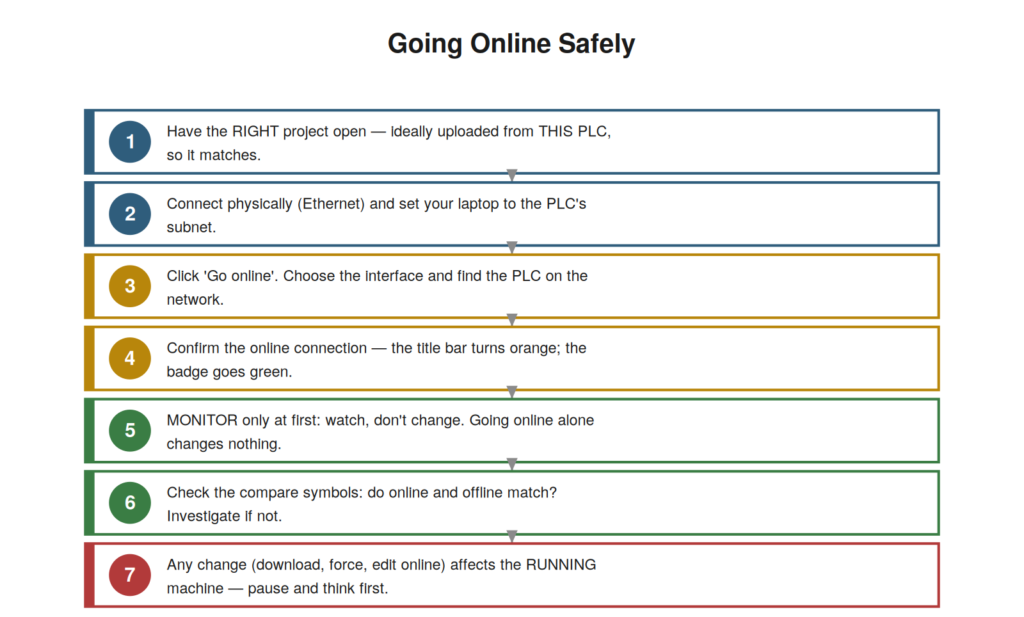
uploaded from this PLC), connect and match the subnet, go online and
confirm, then monitor only — watching changes nothing. Check the compare
symbols, and remember any change affects the running machine.
Going online safely
Going online is safe in itself — it establishes a monitoring
connection without changing anything — but doing it properly ensures you
are looking at the right thing and ready to work effectively. The safe
process is: have the right project open (ideally one uploaded from this
very PLC, so it matches what is running), connect physically and set the
network correctly, initiate go online and confirm the connection, and
then monitor only — watching, not changing. Going online alone changes
nothing in the machine; it simply lets you observe. A good habit is to
check the compare symbols once online, to confirm your project matches
the running program, so you know you are seeing an accurate picture. And
throughout, remember that while monitoring is safe, any actual change
(download, force, edit) would affect the running machine. Understanding
how to go online safely — right project, proper connection, confirm,
monitor only, check the match — lets you get online confidently. It
reinforces that going online is a safe, observation-only action when
done properly, letting you monitor without affecting the machine,
provided you have the right project and remember that changes (as
opposed to monitoring) affect the machine. Understanding the safe
go-online process — and that monitoring itself changes nothing — lets
you get online freely and confidently to observe the running machine,
which is the gateway to the powerful monitoring and diagnosis that
follow, done safely because going online and watching, unlike changing,
does not affect the running machine.
Watching the program run live
The heart of monitoring is watching the program run live in the
editor, where TIA Portal shows the real-time state of the logic — and
understanding how to read this live display is the core maintenance
skill. When you monitor a program block online, the editor displays the
live states: in ladder logic, energized paths (where power is flowing)
are shown highlighted, typically in green, while de-energized paths are
shown normally. So you can see, in real time, which contacts are closed,
which paths are energized, and which outputs are on — the logic actually
executing before your eyes. This live view is extraordinarily
informative: you see not just the program but its current state, which
conditions are met and which are not. Understanding how to read this
live display — highlighted (green) means energized/true, normal means
de-energized/false — is the core skill of monitoring. It reinforces that
monitoring shows the live state of the logic, with energized paths
highlighted, letting you see the program executing and the current
true/false state of every condition. Understanding how to watch the
program run live — reading the highlighting to see what is energized and
what is not — is the central maintenance skill, because it lets you see
exactly what the running program is doing, which conditions are
satisfied and which are not, in real time, providing the direct
observation of the logic’s execution that is the foundation of
diagnosing why a machine is or is not doing something.
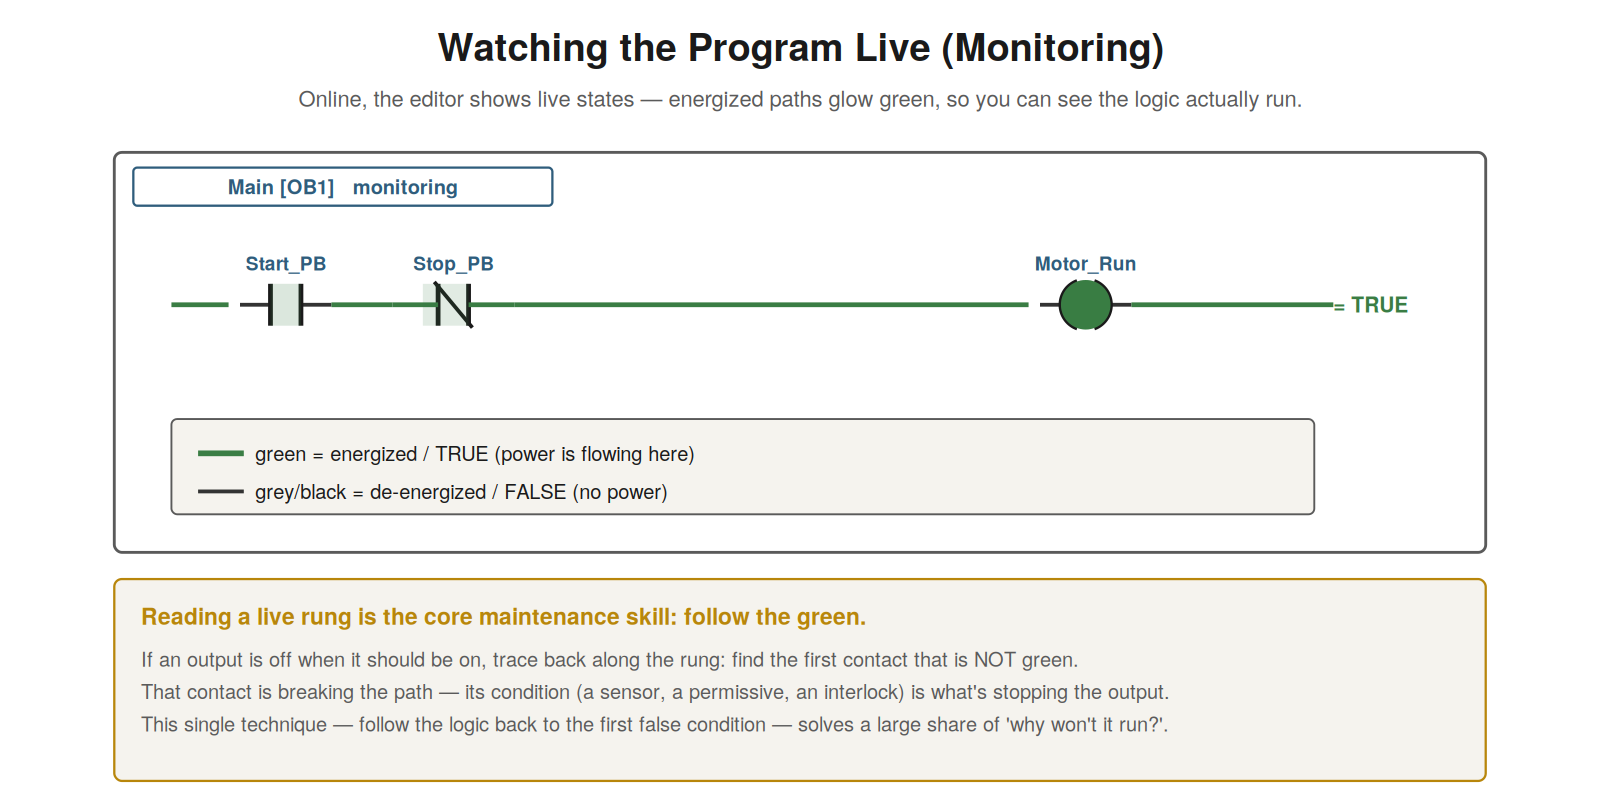
glow green so you can see the logic run. The core diagnostic skill is to
follow the green — when an output is off, trace back to the first
contact that is NOT green; its condition is what’s blocking the
output.
Following the logic to find a problem
The live monitoring becomes a powerful diagnostic when you use it to
follow the logic and find why something is not working — and
understanding this technique is what turns monitoring into diagnosis.
When an output is not turning on though it should, you monitor its rung
and trace the logic: follow the path from the output back toward the
power rail, and find the first contact or condition that is not
energized (not green). That contact is breaking the path — its condition
(a sensor, a permissive, an interlock, a fault bit) is what is
preventing the output. Having found the breaking condition, you know
what to investigate: why is that sensor not made, that permissive not
satisfied, that interlock not met? This technique — trace the rung back
to the first false condition — solves a large share of ‘why won’t it
run?’ problems, directing you straight to the responsible condition.
Understanding this technique — following the live logic back to the
first false condition that breaks the path — turns monitoring into
diagnosis. It reinforces that live monitoring diagnoses problems by
letting you trace a rung back to the condition preventing an output,
which is the responsible cause. Understanding how to follow the logic to
find a problem — tracing back to the first false condition — is the key
diagnostic use of monitoring, converting the live view of the logic into
a direct method for finding why an output is off, by identifying the
condition that is breaking the logic path, which is a large part of
practical PLC troubleshooting and the reason live monitoring is so
valuable to the maintenance technician.