Beyond the diagnostics buffer, TIA Portal shows the health of each
device and module through status icons and detailed diagnostics, letting
you spot and investigate failed hardware. Where the buffer tells you
what happened, the device and module diagnostics tell you where — which
module or device has failed. Understanding how to read these
diagnostics, from the at-a-glance status icons to the detailed module
information, is essential for diagnosing hardware faults.
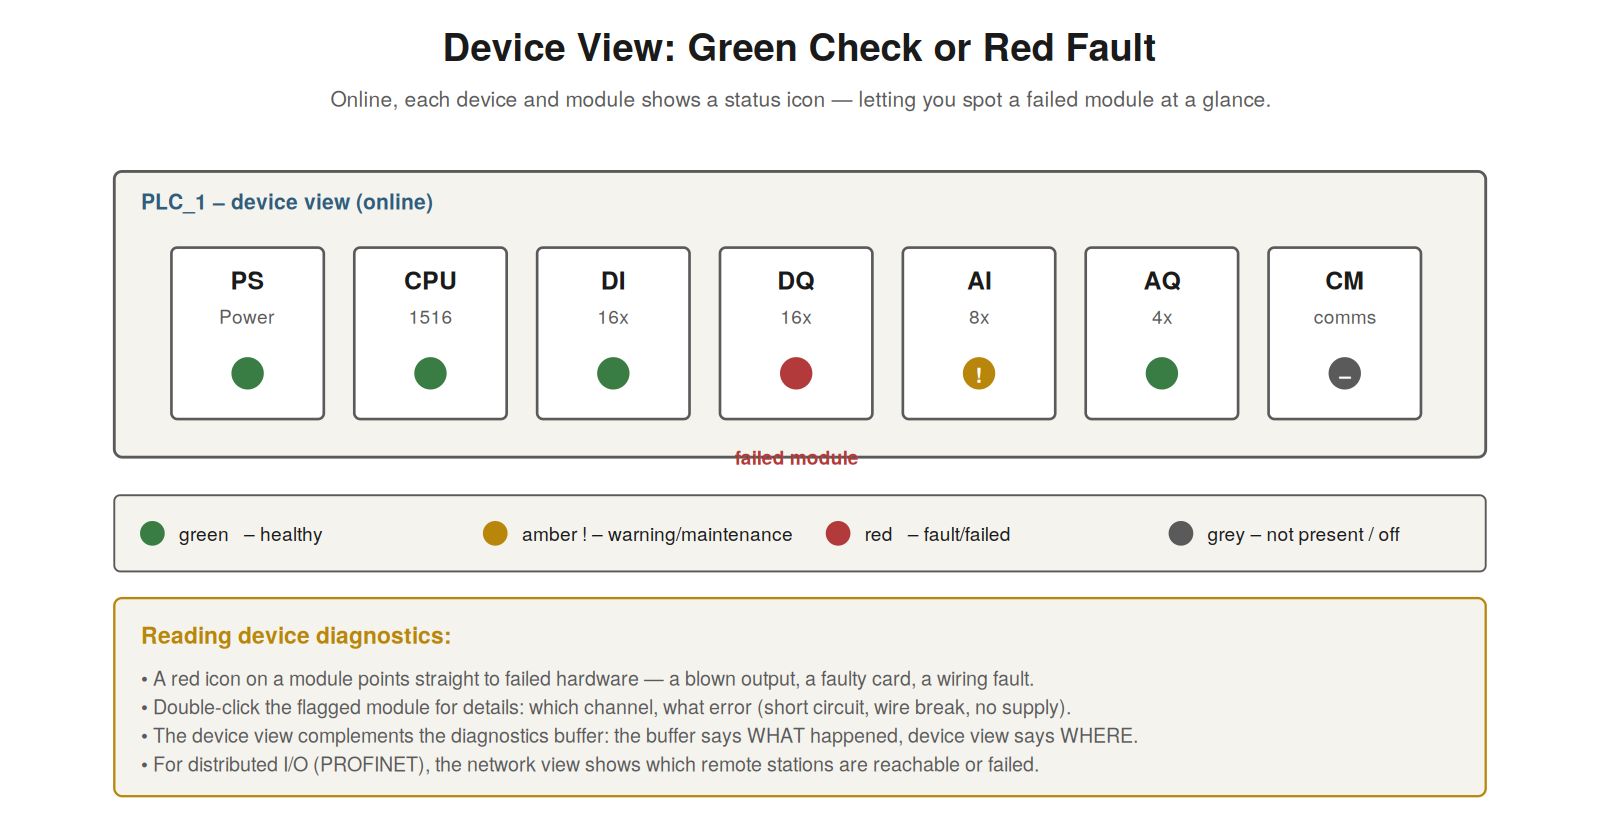
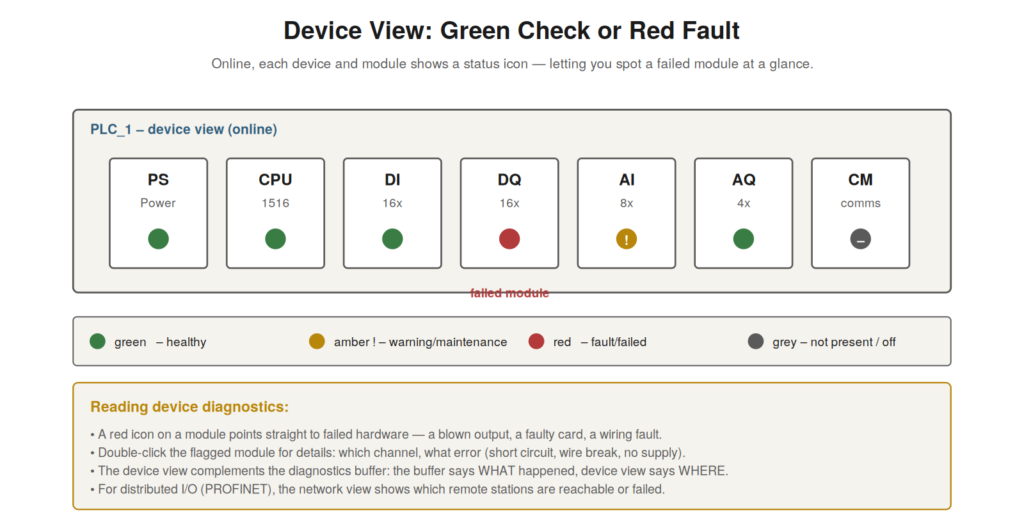
— green check (healthy), amber (warning/maintenance), red
(fault/failed), grey (not present). A red icon points straight to failed
hardware; double-click for details on which channel and what
error.
Status at a glance
When online, TIA Portal shows each device and module with a status
icon, letting you spot a problem at a glance — a quick, powerful
diagnostic overview. In the device view, each module displays an icon
indicating its health: a green check for healthy, an amber icon for a
warning or maintenance condition, a red icon for a fault or failure, and
grey for not present or off. So a glance at the device view shows the
health of all the modules, and a red icon immediately identifies a
failed module. This at-a-glance status is powerful for quickly locating
a hardware problem: rather than investigating blindly, you see which
module is flagged. Understanding the status icons — green healthy, amber
warning, red fault, grey absent — lets you read the device health at a
glance. It reinforces that the device view shows each module’s status
with an icon, so a red icon quickly identifies a failed module, giving
an immediate overview of hardware health. Understanding the
status-at-a-glance icons — and especially that a red icon points
straight to failed hardware — gives you a fast way to locate a hardware
fault, seeing which module has a problem without blind investigation,
which directs the diagnosis immediately to the flagged module, making
the device view’s status icons a valuable quick overview of hardware
health that pinpoints failed modules at a glance.
Detailed module diagnostics
Beyond the at-a-glance status, double-clicking a flagged module shows
detailed diagnostics — the specifics of what is wrong — which directs
the repair precisely. When a module shows a fault, opening its detailed
diagnostics reveals the specifics: which channel is affected, and what
the error is — a short circuit, a wire break, a missing field supply, an
over-range signal, or a module failure. This detail turns ‘this module
has a fault’ into ‘this specific channel has this specific problem’,
which directs the repair precisely: a wire break points to the field
wiring, a short to the wiring or device, a missing supply to the power,
a module failure to replacing the module. So the detailed module
diagnostics specify the fault, guiding the exact repair. Understanding
the detailed diagnostics — the specific channel and error, revealed by
opening the flagged module — lets you pinpoint the fault. It reinforces
that beyond the status icon, the detailed module diagnostics specify
which channel and what error, directing the precise repair.
Understanding how to read the detailed module diagnostics — the specific
channel and fault type — completes the hardware diagnosis, turning the
at-a-glance identification of a failed module into the specific
knowledge of what is wrong with which channel, which directs the exact
repair (the wiring, the supply, the device, or the module), so that
device diagnostics take you from spotting a failed module to knowing
precisely what to fix, which is the goal of hardware fault
diagnosis.
Distributed I/O and the network
Many machines use distributed I/O — modules located out on the
machine, connected over a PROFINET network — and diagnosing these
involves the network view, which shows which remote stations are
reachable or failed. Rather than all I/O being in the central rack,
distributed I/O places modules around the machine, connected to the CPU
over the network. When a distributed station fails or becomes
unreachable (a power loss, a cable problem, a connector fault), it shows
in the network view and typically generates a diagnostics buffer entry
about the station being unreachable. The network view shows the devices
on the network and their status, letting you see which distributed
stations are healthy and which have failed. So diagnosing distributed
I/O uses the network view to identify a failed or unreachable station,
then the usual module diagnostics for the specifics. Understanding
distributed I/O and the network view — remote stations over PROFINET,
with their status shown in the network view — extends hardware diagnosis
to distributed systems. It reinforces that distributed I/O stations,
connected over the network, are diagnosed via the network view showing
their reachability, complementing the module diagnostics. Understanding
distributed I/O and the network view — how to see which remote stations
are reachable or failed — extends your hardware diagnosis to the common
case of distributed I/O, where a failed or unreachable station (from
power, cable, or connector problems) is identified in the network view,
so that you can diagnose not just central-rack modules but the
distributed stations that many machines use, locating a failed remote
station over the PROFINET network that connects it to the CPU.
The LEDs on the hardware itself
Complementing TIA Portal’s on-screen diagnostics, the hardware itself
has status LEDs, and understanding them lets you diagnose at the machine
without a laptop. Siemens modules have LEDs indicating their status: a
run/stop indication on the CPU, error and maintenance LEDs, and
per-channel or per-module status LEDs on I/O modules. These LEDs show,
right on the hardware, whether a module is healthy, faulted, or has a
channel problem — often mirroring what TIA Portal’s device diagnostics
show on screen. So at the machine, even without a laptop, you can read
the module LEDs to see status: a lit error LED on a module points to a
fault there, matching what the on-screen diagnostics would show. This is
valuable for a quick check at the hardware. Understanding the hardware
LEDs — the on-module status indicators — lets you diagnose at the
machine directly. It reinforces that the modules have status LEDs
mirroring the on-screen diagnostics, so you can read module status at
the hardware without a laptop. Understanding the hardware LEDs — the
status indicators on the CPU and modules — complements the on-screen
diagnostics, letting you check module and CPU status right at the
machine, which is valuable for a quick assessment before or without
connecting a laptop, so that the physical LEDs and the on-screen device
diagnostics together give you two ways to read hardware status — at the
machine via the LEDs, and in detail via TIA Portal — both pointing to
the same module faults.
Scenario: the red icon that saved time
A scenario shows device diagnostics quickly locating a hardware
fault. A machine had stopped, and the diagnostics buffer indicated a
module fault. Going to the device view, the technician saw at a glance a
red icon on one specific output module — the failed hardware,
immediately identified. Double-clicking it for detailed diagnostics
showed the specifics: a short circuit on a particular output channel.
This pointed straight to that channel’s field wiring or the connected
device. Investigating, they found a shorted output wire, which they
repaired. The whole hardware localization — from ‘a module fault’ to
‘this channel has a short’ — had taken moments, thanks to the device
view’s clear red icon and the detailed diagnostics. Without them,
locating the failed channel among many would have taken far longer. This
scenario shows device diagnostics — the red icon and detailed
diagnostics — quickly locating a hardware fault to a specific channel.
Understanding the status icons and detailed diagnostics let the
technician spot the failed module at a glance and pinpoint the shorted
channel, saving time. It reinforces that the device view’s status icons
and detailed diagnostics quickly locate hardware faults to the specific
module and channel. The scenario reinforces the value of device
diagnostics: the red icon immediately identified the failed module and
the detailed diagnostics pinpointed the shorted channel, illustrating
how device diagnostics quickly take you from a general module fault to
the specific failed channel, saving the time that locating hardware
faults would otherwise take.
Module faults versus channel faults
A useful distinction in device diagnostics is between a whole-module
fault and a single-channel fault, because they point to different
problems and repairs. A module diagnostic may indicate the whole module
has failed (a module-level fault — the card itself is bad, needing
replacement) or that a specific channel has a problem (a channel-level
fault — like a wire break or short on one input or output, pointing to
that channel’s field wiring or device rather than the module itself).
Distinguishing these matters: a whole-module failure means replacing the
module, while a single-channel fault usually means a field problem
(wiring or device) on that channel, with the module itself fine. The
detailed diagnostics show which — module-level or channel-level —
guiding the repair appropriately. So reading whether a fault is
module-wide or channel-specific directs you to the right repair.
Understanding module faults versus channel faults — whole-module failure
versus a single-channel problem — guides the repair correctly.
Understanding module faults versus channel faults — distinguishing a
failed module (needing replacement) from a single-channel problem
(usually a field wiring or device fault on that channel) — guides you to
the right repair, so that you do not replace a module when the problem
is actually a wire break on one channel, nor chase field wiring when the
module itself has failed, reading the detailed diagnostics to see
whether the fault is module-wide or channel-specific and directing the
repair accordingly, which is an important distinction for efficient and
correct hardware repair.
Hardware diagnosis made direct
Consolidating the device-diagnostics material, TIA Portal makes
hardware diagnosis direct — showing you which hardware has failed and
how — and appreciating this emphasizes its value for hardware faults.
Diagnosing hardware faults without such tools would mean inferring from
symptoms which module or channel might be at fault — slow and uncertain.
TIA Portal’s device diagnostics make it direct: the status icons show
which module has failed, and the detailed diagnostics show what is wrong
(which channel, what fault). So hardware diagnosis becomes a matter of
reading what TIA Portal directly shows, rather than inferring — far
faster and more certain. This directness is the value of device
diagnostics: they turn hardware fault-finding from inference into
reading. So for any hardware fault, the device diagnostics are the
direct route to what has failed and how. Understanding hardware
diagnosis made direct — device diagnostics showing which hardware failed
and how — emphasizes their value for hardware faults. Understanding that
device diagnostics make hardware diagnosis direct — showing which module
has failed and what is wrong, rather than leaving you to infer from
symptoms — emphasizes their value for hardware faults, so that you use
the device view’s status icons and detailed diagnostics as the direct
route to identifying failed hardware and its specific fault, turning
hardware fault-finding from slow, uncertain inference into the fast,
certain reading of what TIA Portal directly shows, which is the great
value of device diagnostics for the hardware faults that are a
significant part of maintenance work.