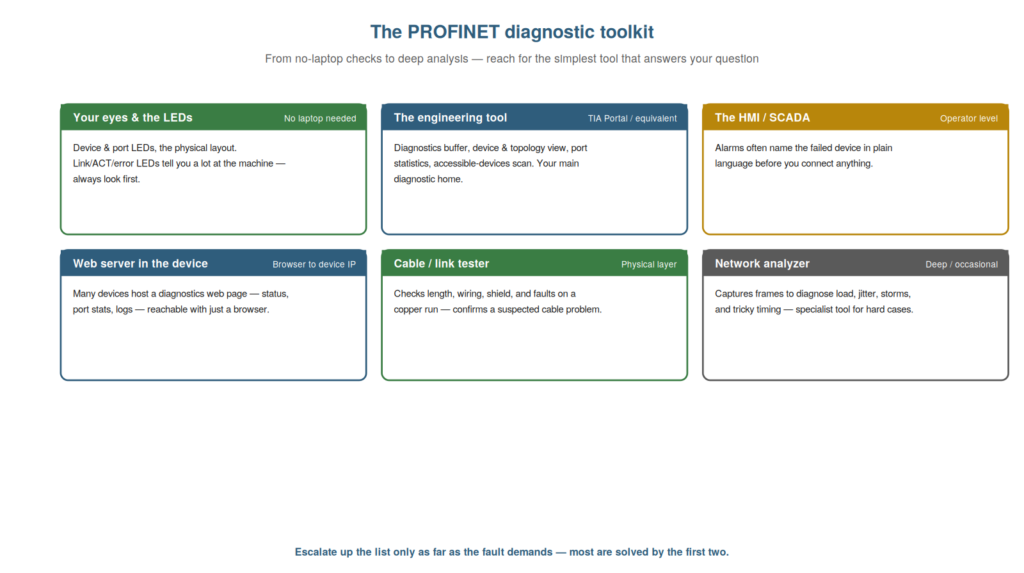
A capable PROFINET troubleshooter draws on a range of diagnostic
tools, from the simplest no-laptop checks to specialist analyzers, and
understanding the toolkit — what each tool offers and when to reach for
it — makes your diagnosis efficient. The guiding principle is to use the
simplest tool that answers your question, escalating only as far as the
fault demands. This chapter surveys the diagnostic toolkit for the
maintenance technician.
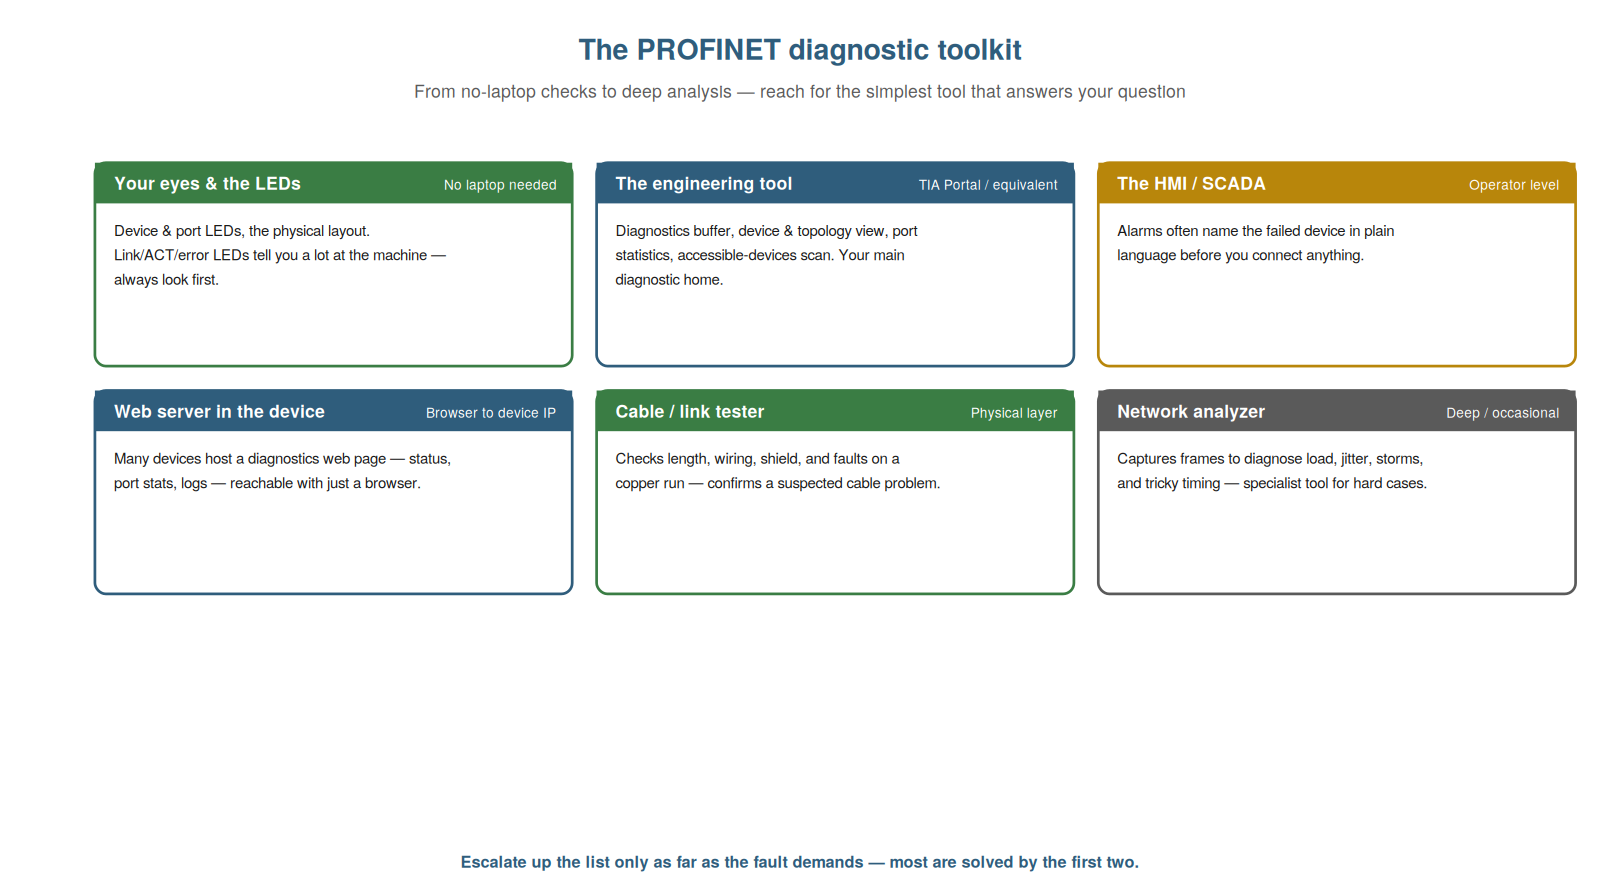
and the LEDs (no laptop), the engineering tool (your main home), the
HMI/SCADA alarms, the device’s web server, a cable/link tester for the
physical layer, and a network analyzer for deep cases. Most faults are
solved by the first two.
From LEDs to the engineering tool
The two tools that resolve most PROFINET faults are the simplest —
your eyes on the LEDs, and the engineering tool — and understanding
their primary roles focuses your everyday troubleshooting. Your eyes and
the LEDs need no laptop: the device and port status LEDs, and the
physical layout, tell you a great deal at the machine — link status,
activity, faults — and should always be your first look. The engineering
tool (TIA Portal or equivalent) is your main diagnostic home: the
diagnostics buffer, device and topology views, port statistics, and
accessible-devices scan give you the detailed picture of the network’s
state and faults. So most diagnosis flows through these two: look at the
LEDs first (immediate, physical clues), then turn to the engineering
tool (detailed diagnostics). Together they resolve the majority of
faults, which is why they are the core of the toolkit. Understanding the
primary roles of the LEDs and the engineering tool — the immediate first
look and the detailed diagnostic home — focuses your everyday
troubleshooting on these two. It reinforces that the LEDs (first,
no-laptop look) and the engineering tool (detailed diagnostic home)
resolve most faults and are the core of the toolkit. Understanding the
roles of the LEDs and the engineering tool — the LEDs as your immediate,
no-laptop first look and the engineering tool as your detailed
diagnostic home — focuses your everyday troubleshooting on the two tools
that resolve most PROFINET faults, so that you begin with the LEDs at
the machine and proceed to the engineering tool’s diagnostics, which
between them handle the majority of situations and form the core of the
diagnostic toolkit, with the other tools reserved for the cases these
two do not resolve.
The other tools and when to use them
Beyond the core two, several other tools address specific situations,
and understanding when to reach for each rounds out the toolkit. The HMI
or SCADA operates at the operator level and often names a failed device
in plain-language alarms before you connect anything — a quick first
indication. The device’s built-in web server, reachable with just a
browser at the device’s IP, often provides diagnostics — status, port
statistics, logs — useful when you have network access but not the
engineering tool. A cable or link tester addresses the physical layer
directly, checking a copper run’s length, wiring, and faults to confirm
a suspected cable problem. A network analyzer, a specialist tool,
captures the actual frames to diagnose load, timing, storms, and tricky
problems — reserved for the hard cases the simpler tools cannot resolve.
So each additional tool has its niche: the HMI for a quick named alarm,
the web server for browser-based device diagnostics, the cable tester
for confirming physical faults, the analyzer for deep analysis.
Understanding when to use each — matching the tool to the situation —
rounds out the toolkit. It reinforces that the HMI (named alarms), web
server (browser diagnostics), cable tester (physical confirmation), and
analyzer (deep cases) each address specific situations beyond the core
two. Understanding the other tools and when to use them — the HMI or
SCADA for a quick plain-language alarm, the device web server for
browser-based diagnostics, the cable tester for confirming physical
faults, and the network analyzer for deep analysis of hard cases —
rounds out your diagnostic toolkit, so that you can match the right tool
to each situation, reaching beyond the core LEDs and engineering tool
when a fault calls for it, while remembering that most faults are
resolved by the simpler tools and the specialist ones are reserved for
the cases that genuinely require them.
Choosing the simplest sufficient tool
The guiding principle for using the toolkit well is to choose the
simplest tool that answers your question, and understanding this
principle keeps your troubleshooting efficient. The tools form a rough
progression from simple to complex: LEDs, engineering tool, HMI, web
server, cable tester, analyzer. The efficient approach is to start
simple and escalate only as far as the fault demands: begin with the
LEDs (which often suffice for a physical fault), turn to the engineering
tool (which handles most detailed diagnosis), and reach for the more
specialist tools only when the simpler ones have not resolved the fault.
This avoids the waste of deploying a complex tool for a simple fault —
setting up a network analyzer for what a glance at the LEDs would have
shown. So choosing the simplest sufficient tool means matching your
effort to the fault, escalating deliberately. This keeps troubleshooting
efficient, solving simple faults simply and reserving the heavy tools
for the hard cases. Understanding the principle — the simplest tool that
answers the question, escalating only as needed — keeps your use of the
toolkit efficient. It reinforces starting with the simplest tools and
escalating only as far as the fault demands, matching effort to the
fault rather than over-tooling simple problems. Understanding the
principle of choosing the simplest sufficient tool — starting with the
LEDs and engineering tool and escalating to the specialist tools only as
far as the fault genuinely demands — keeps your troubleshooting
efficient, so that you match your diagnostic effort to the fault,
solving the many simple faults simply with the basic tools and reserving
the cable tester, web server, and network analyzer for the cases that
truly require them, which avoids both the waste of over-tooling and the
frustration of under-tooling, using the right tool for each fault.
The device web server in practice
A tool worth understanding in more practical detail is the device’s
built-in web server, because it offers useful diagnostics with nothing
more than a browser. Many PROFINET devices (and controllers) host a web
server: you connect to the device’s IP address in an ordinary web
browser and see diagnostic pages — the device’s status, its port
statistics and link states, its diagnostics and logs, and identity
information. This is useful when you have network access and a browser
but not the full engineering tool, or as a quick check: you can see a
device’s own view of its health and ports without the project. The web
server is read-mostly for diagnostics (though some allow configuration,
which is a careful change). So understanding the device web server —
browser-accessible diagnostics at the device’s IP — gives you a handy
tool needing only a browser. Understanding the device web server in
practice — that many devices host browser-accessible diagnostic pages at
their IP address, showing status, port statistics, and logs — gives you
a handy diagnostic tool needing only a browser, so that when you have
network access but not the full engineering tool, or want a quick check
of a device’s own view of its health and ports, you can browse to the
device and read its diagnostics directly, which is a convenient and
often-overlooked tool that complements the engineering tool with
device-level diagnostics reachable from any browser on the network.
Scenario: the browser diagnosis
A scenario shows the device web server providing a quick diagnosis. A
technician needed to check a device’s health but did not have the full
engineering project to hand — only network access from a laptop with a
browser. Rather than being stuck, he used the device’s built-in web
server: he browsed to the device’s IP address and reached its diagnostic
pages, which showed the device’s status, its port statistics, and its
logs. From these he could see that one of the device’s ports had a
rising error count and intermittent link drops — a physical problem on
that link — all without the engineering tool. This let him diagnose the
fault (a degrading link on that port) with just a browser. The web
server had provided the diagnosis when the full tool was not available.
This scenario shows the device web server providing a diagnosis with
just a browser. Understanding that devices host browser-accessible
diagnostics let the technician diagnose a port problem without the
engineering tool. It reinforces that the device web server provides
useful diagnostics (status, port stats, logs) with just a browser,
useful when the full tool is unavailable. The scenario reinforces the
value of knowing the whole toolkit: the technician diagnosed a degrading
link using only the device’s web server and a browser, when he lacked
the full engineering tool, illustrating how the device web server is a
handy tool that provides device-level diagnostics from any browser,
filling in when the main tool is not available and rounding out the
diagnostic options beyond the core LEDs and engineering tool.
Knowing your tool’s specific features
A practical point about the engineering tool is that knowing its
specific diagnostic features well pays off, and understanding this
encourages you to learn your particular tool thoroughly. The engineering
tool (TIA Portal or another) has many diagnostic features — the buffer,
topology view, device diagnostics, port statistics, accessible-devices
scan, comparison functions, and more — and knowing where they are and
how to use them in your specific tool makes your diagnosis fast and
effective. A technician fluent in their tool’s features reaches the
right diagnostic quickly; one who struggles with the tool is slowed
regardless of understanding. So investing time to learn your specific
tool’s diagnostic features — exactly where each is and how to use it —
pays off in every diagnosis. This is worth doing deliberately: exploring
the tool’s diagnostics when not under pressure, so they are familiar
when you need them. Understanding the value of knowing your tool’s
features — fluency making diagnosis fast — encourages learning your
specific tool thoroughly. Understanding that knowing your tool’s
specific diagnostic features pays off — fluency with the buffer,
topology, device diagnostics, statistics, scans, and comparisons of your
particular engineering tool making diagnosis fast and effective —
encourages you to learn your tool thoroughly, so that you invest time
exploring its diagnostic features when not under pressure, making them
familiar for when you need them, which pays off in every diagnosis
because fluency with the tool lets you reach the right diagnostic
quickly, complementing your understanding of PROFINET with the practical
command of the specific tool through which you apply it.
The right tool, ready to hand
To close, it helps to emphasize having the right tools ready and
knowing them well, because preparedness is what lets the toolkit serve
you when a fault strikes. Knowing the tools is one thing; having them
ready and familiar is another. The technician prepared for PROFINET
faults has the engineering tool installed and knows it, has access to a
browser for device web servers, has a cable tester available, knows
where a network analyzer can be obtained if needed, and — above all —
always has their eyes for the LEDs. This readiness means that when a
fault strikes, the right tool is at hand and familiar, not something to
scramble for. So preparedness — the right tools ready and known — lets
the toolkit serve you effectively in the moment. This is worth attending
to before faults occur: ensuring the tools are available and familiar,
so they are ready when needed. Understanding the value of having the
right tool ready to hand — prepared and familiar — lets the toolkit
serve you when a fault strikes. Understanding the value of having the
right tool ready to hand — the engineering tool installed and known, a
browser available, a cable tester accessible, an analyzer obtainable,
and always your eyes for the LEDs — lets the toolkit serve you
effectively when a fault strikes, so that you attend to preparedness
before faults occur, ensuring the tools are available and familiar
rather than something to scramble for in the moment, which is what turns
knowledge of the toolkit into practical readiness that serves you the
instant a PROFINET fault demands a particular tool.