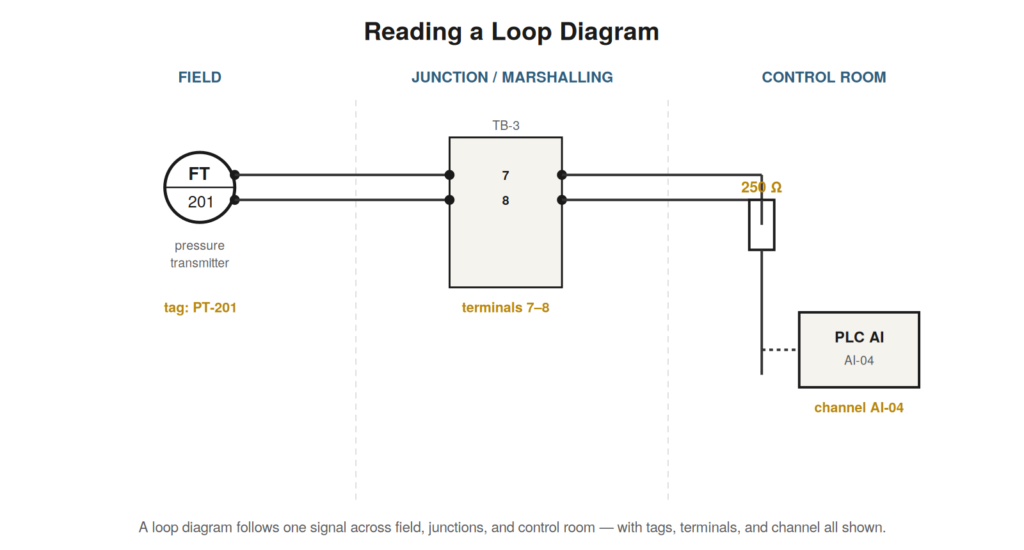
In a real plant, a loop is documented by a loop diagram — a drawing that follows one signal from the field device, through junction boxes and marshalling, to the control system input. Reading loop diagrams is the skill that connects the abstract loop to the physical installation, telling you exactly what connects to what and where each part is located, which is indispensable for troubleshooting.
What a loop diagram shows
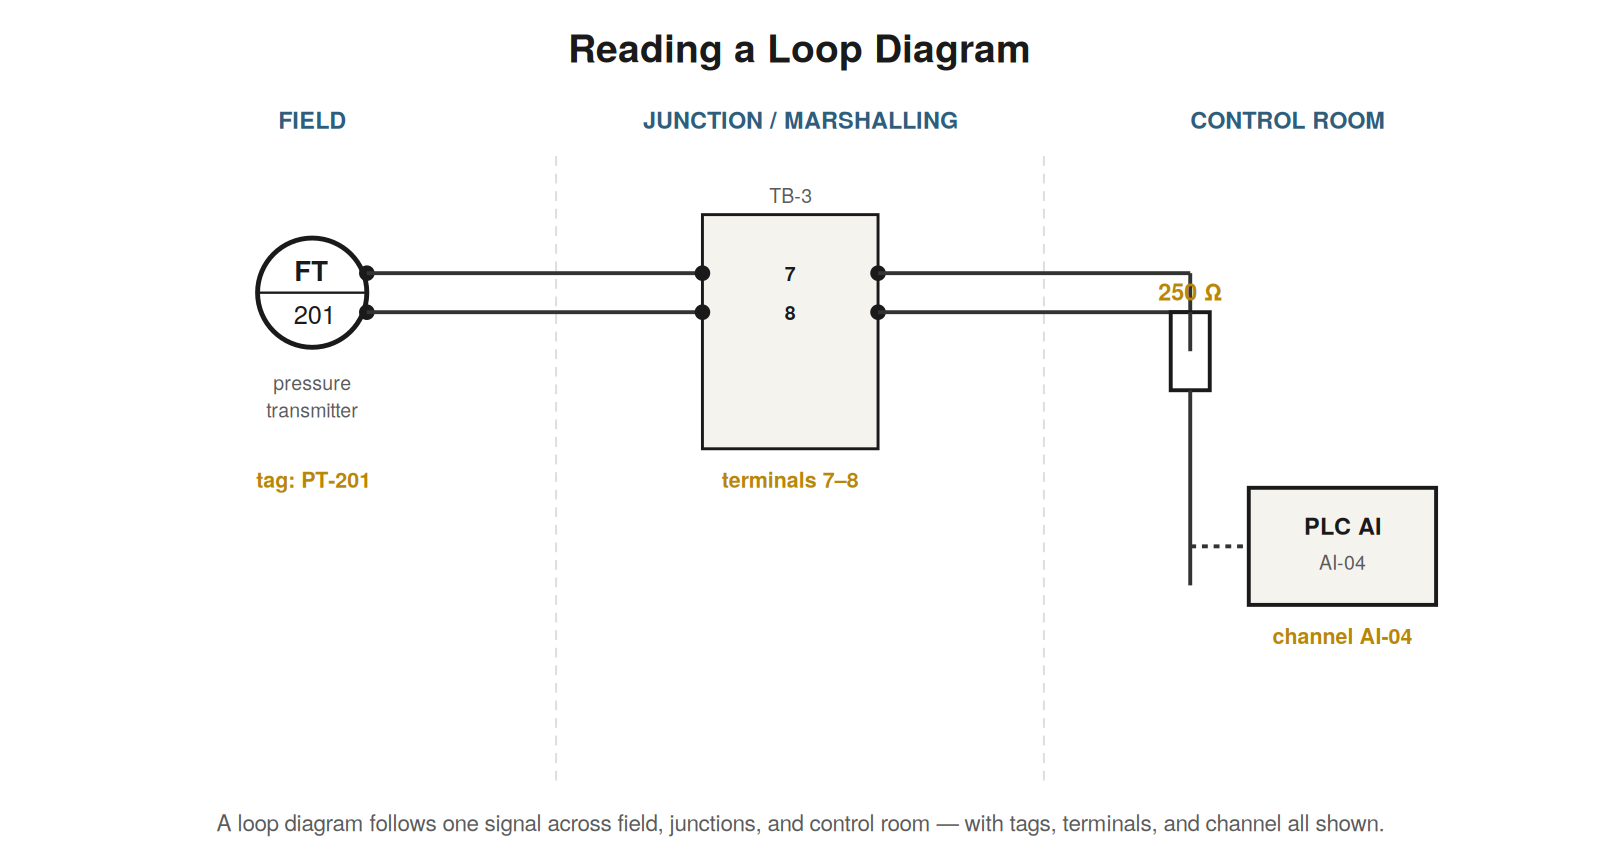
A loop diagram is organized to follow a single loop across the plant, typically in columns representing the field, any intermediate junction or marshalling points, and the control room. It shows the field instrument with its tag (a unique identifier like PT-201), the wiring from the instrument to terminal blocks, the terminal numbers at each junction, and finally the control-system input channel that receives the signal. Everything needed to trace and locate the loop is on the diagram: the tag identifies the device, the terminal numbers locate the connections at each junction, and the channel identifies where the signal arrives in the control system. Reading a loop diagram means following this path across the columns, understanding how the one signal travels from field to control room through the identified terminals and connections. This is the document you use to know exactly where a given loop’s wiring runs and where you can access it for measurement.
Tags, terminals, and channels
Three kinds of identifiers on a loop diagram are especially important for troubleshooting. The instrument tag uniquely names the field device and appears on the device itself, letting you match the diagram to the physical instrument. The terminal numbers identify the specific terminals at each junction box or marshalling panel where the loop’s wires connect, letting you find the exact physical points to measure at. And the channel or input address identifies where the signal enters the control system, letting you correlate the loop with its reading in the control software. Reading these identifiers from the loop diagram gives you the complete physical map of the loop: which device (tag), through which terminals, to which channel. When a loop reads wrong, this map tells you where every part of it is — the device to inspect, the terminals to measure at, the channel to check in the control system — which is exactly what you need to locate and access the loop for diagnosis.
Using the loop diagram to plan a diagnosis
The loop diagram is not just a record but a troubleshooting tool, because it shows the access points where you can measure along the loop. The terminal blocks at junctions are places where the loop is accessible, and the diagram shows where they are and which terminals carry the loop. Planning a diagnosis with the loop diagram means using these access points to divide the loop — measuring at a junction to determine whether the fault is upstream or downstream of it, which is the basis of the split-half technique covered later. Reading the loop diagram to identify the accessible terminals, and understanding what is on each side of them, lets you plan where to measure to localize a fault efficiently. The loop diagram thus does double duty: it documents the loop’s construction, and it reveals the access points that make systematic troubleshooting possible, turning the physical loop into something you can measure at strategic points to narrow down a fault.
The loop diagram versus the schematic
It is worth distinguishing a loop diagram from a general schematic, because they serve different purposes and reading them differs. A schematic shows how a circuit works logically; a loop diagram shows how one specific instrument loop is physically installed — the actual devices, wires, terminals, and locations for one measurement point. The loop diagram is organized around following that single loop from its field device to its control-system input, with the emphasis on physical connections and identifiers rather than logical function. This physical, single-loop focus is exactly what troubleshooting needs, because when a loop faults you need to know its physical construction — what connects where — to trace and access it. Reading a loop diagram is therefore a specific skill oriented to physical tracing: following the one loop across its columns, noting every device, terminal, and identifier along its physical path. Where a schematic answers ‘how does this work,’ a loop diagram answers ‘how is this loop actually wired and where is each part,’ which is the question troubleshooting asks.
Building a mental model from the diagram
A skilled troubleshooter reads a loop diagram not just to look up a connection but to build a mental model of the whole loop — a picture of the complete series circuit from supply through transmitter, wiring, junctions, and receiver. With this model in mind, you understand where the current flows, where the access points are, and what each part contributes, which lets you reason about the loop and plan a diagnosis. Building the model means reading the whole diagram, following the loop end to end, and understanding it as one circuit rather than a collection of disconnected details. This mental model is what makes the subsequent troubleshooting fluent: with the whole loop pictured, you can decide where to split it, what a measurement at a given point would tell you, and how to isolate each element. Reading the loop diagram to build this complete mental model, rather than just to find one connection, is the difference between using the diagram as a lookup table and using it as the map that guides an efficient diagnosis of the whole loop.
Scenario: the loop diagram that saved an hour
A scenario illustrates the loop diagram’s practical value. A loop was reading wrong, and the field device was somewhere in a large, complex plant with many similar instruments and junction boxes. Without the loop diagram, finding the right device and tracing its wiring through the plant would have taken a long time — identifying which of many instruments it was, which junctions its wires passed through, which control-system channel it fed. With the loop diagram, all of this was immediate: the tag identified the exact device, the diagram showed which junction boxes and terminals its wiring used, and the channel identified where it reached the control system. The technician went straight to the right device and the right access points, and localized the fault quickly using the junctions the diagram identified. The loop diagram turned what could have been an hour of searching for the physical loop into a direct path to it. This scenario shows why finding the loop diagram first is such good practice: it provides the complete physical map — device, wiring, terminals, channel — that lets you go straight to the loop and its access points rather than searching the plant for them.
When the loop diagram is wrong
As with any documentation, a loop diagram can be out of date, and knowing how to handle a diagram that disagrees with the installation is part of using it wisely. Loops get modified — rewired, rerouted, devices added or changed — and if the diagram is not updated, it no longer matches reality. When troubleshooting with a loop diagram, staying alert for disagreements — wiring that does not match, terminals that differ, devices not shown — protects you from being misled. Where the diagram and the installation conflict, the installation is the truth: the actual wiring is what carries the current, and the diagram is only a representation that may have fallen behind. Verifying critical points against the actual installation, rather than trusting the diagram blindly, especially when a measurement contradicts it or the loop is known to have been modified, keeps an outdated diagram from misdirecting the diagnosis. And when a discrepancy is found, marking up the diagram to reflect reality corrects it for the future. The loop diagram is an invaluable guide, but like any drawing it must be held as a usually-correct representation to be verified where it matters, not as infallible truth.
The loop diagram as a troubleshooting starting point
Making the loop diagram the starting point of every loop diagnosis is a habit that repays itself many times over, and it is worth adopting deliberately. Before touching the loop, retrieving and reading its diagram gives you the complete physical map — the device, the wiring, the terminals, the channel — and the access points for measurement. Starting here means you approach the loop already knowing its layout and where you can measure, rather than discovering these as you go. This upfront orientation makes the whole diagnosis faster and surer: you go straight to the right device, know where the junctions are for splitting, and understand the loop’s construction before investigating its fault. The small time spent reading the diagram first is repaid by the efficiency it brings to everything after. Technicians who skip the diagram and dive into the loop often spend more time overall, discovering the layout the hard way, than those who start with the diagram and proceed with a clear map. Adopting the habit of starting every loop diagnosis with the loop diagram — orienting fully before acting — is a simple discipline that consistently makes loop troubleshooting more efficient, which is why it is worth making automatic.
Following the signal across the columns
The core skill in reading a loop diagram is following the one signal across the diagram’s columns from field to control room, and practicing this traces the whole loop. Starting at the field device in the leftmost column, follow its wiring to the right: to the first junction and its terminals, then onward to any marshalling panel and its terminals, then finally to the control-system input in the rightmost column. At each column, note the identifiers — the tag at the field device, the terminal numbers at each junction, the channel at the control system — and the wiring connecting them. Following this path across the columns traces the complete physical route of the signal from where it originates to where it is used, which is exactly the map you need to understand and access the loop. Practicing this following — tracing the one signal across the columns, noting each identifier and connection — builds fluency in reading loop diagrams, so that you can quickly grasp a loop’s complete physical layout from its diagram. The loop diagram is organized precisely to support this following of the signal across the columns, and reading it this way — tracing the whole path from field to control room — extracts the full physical map the diagram provides.
The loop diagram in the whole workflow
The loop diagram fits into the whole loop workflow — installation, operation, troubleshooting, modification — as the reference that ties them together, and appreciating this shows why keeping it accurate matters. At installation, the loop diagram specifies how the loop is wired. In operation, it documents the loop’s construction for reference. In troubleshooting, it provides the physical map and access points. In modification, it shows the existing loop to be changed and is updated to reflect the change. Throughout the loop’s life, the diagram is the reference that documents and guides work on it, which is why its accuracy is so valuable: an accurate diagram serves all these purposes correctly, while an outdated one misleads them. Keeping the loop diagram accurate — updating it whenever the loop is modified — maintains its value across the whole workflow, ensuring that everyone who references it, for whatever purpose, gets correct information. The loop diagram is not just a troubleshooting aid but the loop’s enduring documentation, serving its whole life cycle, and maintaining its accuracy is part of maintaining the loop itself. Appreciating the diagram’s role across the whole workflow — and the importance of keeping it accurate for all of them — underscores why good documentation practice, updating diagrams as loops change, is integral to competent loop work over the long term.