A scan tool may offer hundreds of data parameters, or PIDs. More data is not automatically better. Choose values that answer a question. If the engine runs rich, useful PIDs might include oxygen/AFR behavior, short- and long-term fuel trims, MAF, MAP, coolant temperature and commanded purge. Randomly watching every available value makes patterns harder to see.
Use three kinds of comparison. First, compare a value with physical reality: ambient temperature versus intake-air temperature after a cold soak. Second, compare related sensors: APP sensor 1 versus APP sensor 2, or all four wheel speeds while driving straight. Third, compare the value with expected behavior as conditions change: MAP should react to throttle and load; coolant temperature should rise smoothly during warm-up.
Graphing is especially useful for intermittent events. A single numerical display can miss a brief dropout. A graph can reveal a sudden step, spike or flat line that occurs exactly when the symptom appears. Many affordable scan tools can graph at least a few PIDs at once.
Keep sample rate in mind. Too many selected PIDs can slow updates, and a slow scan tool can miss fast electrical glitches. Use the scan tool to identify the area, then use a multimeter or oscilloscope for circuit-level proof when needed.
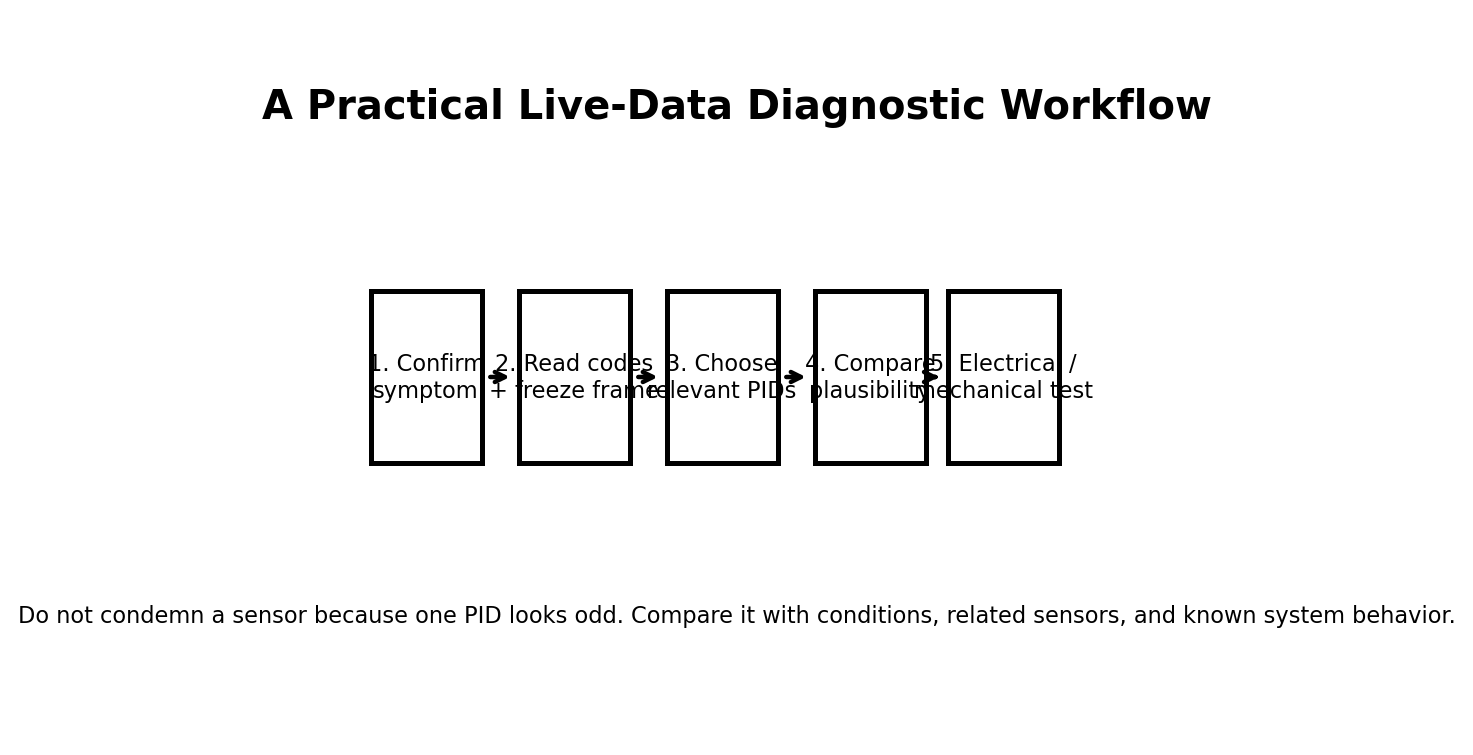
Figure: Using Live Data Without Drowning in Numbers
Diagnostic habit: Compare the sensor reading with reality and with at least one related measurement before buying a part.