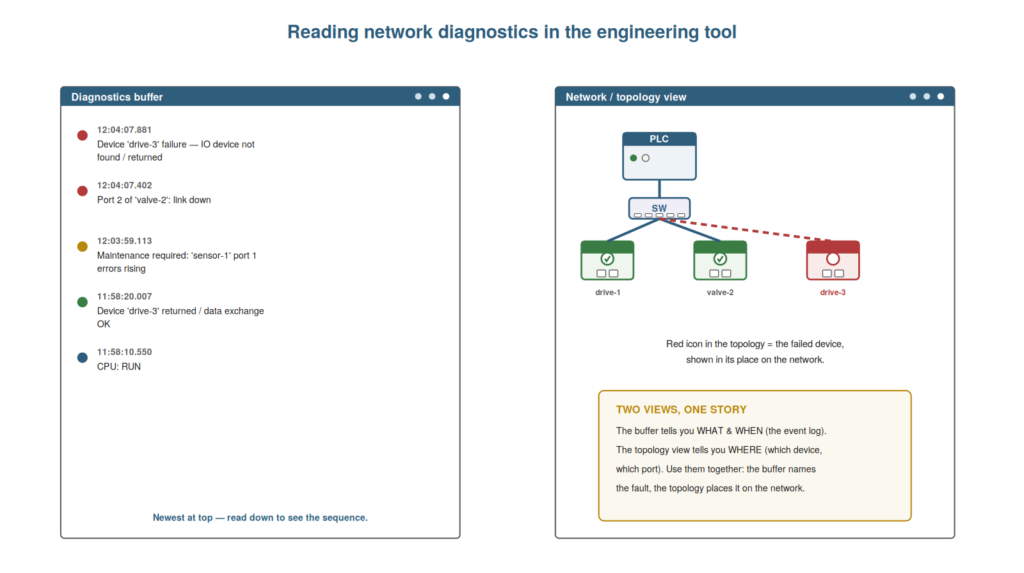
PROFINET is designed to report its own faults, and the engineering
tool presents those reports through two complementary views — the
diagnostics buffer (what happened and when) and the topology or device
view (where it happened). Learning to read these, and to use them
together, is central to network troubleshooting. This chapter covers
reading the network’s diagnostics, so that you can let the network tell
you what is wrong rather than guessing.
timestamped event log (WHAT and WHEN), while the topology / network view
shows the failed device in its place (WHERE). Used together, the buffer
names the fault and the topology places it on the network.
The diagnostics buffer: what and when
The diagnostics buffer is the network’s timestamped event log, and
understanding how to read it — what happened and when — is the starting
point for diagnosing a network fault from the tool. Like the CPU’s own
logbook, the diagnostics buffer records the significant network events
with timestamps: devices failing, ports going down, maintenance
warnings, devices returning, mode changes. The newest events are at the
top, so when a fault occurs, its record is immediately visible. Reading
the buffer tells you what happened (a device failed, a port went down)
and when (the timestamp), and reading down through the events shows the
sequence around the fault. So the diagnostics buffer gives you the
what-and-when of a network fault: the events that occurred, in order,
timestamped. This is usually the first place to look when the tool is
connected and a fault has occurred, because it names the events
directly. Understanding the diagnostics buffer — the timestamped log of
network events, newest first — gives you the what-and-when starting
point. It reinforces that the diagnostics buffer records network events
(failures, port problems, warnings, returns) with timestamps, newest
first, telling you what happened and when. Understanding the diagnostics
buffer as the record of what happened and when — the timestamped event
log that names the network faults directly — is the starting point for
diagnosing from the tool, so that you read the buffer first when a fault
has occurred, learning which devices or ports failed and in what
sequence, which gives you the essential what-and-when that directs the
rest of your diagnosis, just as the diagnostics buffer does for the
controller itself.
The topology view: where
Complementing the buffer’s what-and-when, the topology or network
view shows where a fault is — which device, in its place on the network
— and understanding it lets you locate a fault visually. The engineering
tool can display the network as a topology: the controller, switches,
and devices, with their connections, and each shown with a status. A
failed device appears with a fault indication (a red icon) in its place
in the network layout, so you see not just that a device failed but
where it sits — which device, and its position relative to the others.
This visual placement is powerful for localizing a fault: it shows the
failed device in context, and (where topology is configured) which port
connects to which neighbour, helping you see the physical location and
the affected part of the network. So the topology view gives you the
where of a fault, placing it on the network. Understanding the topology
view — the network layout showing each device’s status and place — lets
you locate a fault visually. It reinforces that the topology view shows
the network layout with device statuses, placing a failed device in its
position, which localizes the fault visually. Understanding the topology
view as showing where a fault is — the network laid out with each
device’s status, placing a failed device in its position and connections
— lets you locate a fault visually and in context, so that beyond
knowing a device failed (from the buffer), you see where it sits on the
network and what it connects to, which helps you find it physically and
understand the affected part of the network, complementing the buffer’s
what-and-when with the crucial where.
Using the two views together
The real diagnostic power comes from using the buffer and topology
views together, and understanding how they complement each other gives
you a complete picture of a network fault. The buffer tells you what
happened and when — the events and their sequence — but not, visually,
where. The topology view shows you where — the failed device in its
place — but not the sequence of events. Used together, they give the
complete story: the buffer names the fault (this device failed, this
port went down, at this time), and the topology places it on the network
(here is that device, connected thus). So your diagnostic approach uses
both: read the buffer for the events and sequence, and read the topology
for the location and context, combining them into a full understanding
of what failed, when, and where. This combined reading is the core of
diagnosing from the tool. Understanding how to use the two views
together — the buffer for what-and-when, the topology for where — gives
you the complete picture. It reinforces that the buffer (what and when)
and topology (where) complement each other, used together for a full
understanding of a network fault. Understanding how to use the
diagnostics buffer and the topology view together — the buffer for what
happened and when, the topology for where it happened — gives you the
complete picture of a network fault, so that you combine the event log’s
naming and sequencing of the fault with the topology’s visual placement
of it on the network, reaching a full understanding of what failed, in
what sequence, and where it sits, which is the core diagnostic method
for reading the network’s own reports of its faults.
Interpreting the event sequence
Getting the most from the diagnostics buffer involves interpreting
the sequence of events, not just the top one, and understanding this
deepens your reading of the buffer. A network fault often generates
several buffer events in sequence: a port link down, then a device
failure, then perhaps downstream devices failing too. Reading the
sequence — the order and timing of these events — tells the story: which
event came first (often the root cause) and which followed as
consequences. For example, a port-link-down event followed immediately
by a device-failed event suggests the link loss caused the failure; a
cluster of device failures right after one event suggests they all
stemmed from that one cause. So interpreting the sequence, using the
timestamps to see the order, distinguishes root causes from consequences
and reveals how the fault unfolded. Understanding how to interpret the
event sequence — reading the order and timing to find the root cause and
its consequences — deepens your reading of the buffer beyond the single
top event. Understanding how to interpret the event sequence in the
diagnostics buffer — reading the order and timing of the events to
distinguish the root cause from its consequences — deepens your
diagnosis, so that rather than reading only the topmost event, you
follow the sequence to see how the fault unfolded (a link dropping, then
a device failing, then downstream devices following), using the
timestamps to identify what came first and likely caused the rest, which
turns the buffer from a list of events into a narrative of the fault
that reveals its root cause and progression.
Scenario: two views, one fault
A scenario shows the buffer and topology views combining for a clear
diagnosis. A machine faulted, and the technician used both diagnostic
views together. The diagnostics buffer told him what and when:
‘valve-island-2 failed’ and ‘port 1 link down’, timestamped at the
moment of the stop — naming the fault and its timing. The topology view
told him where: valve-island-2 shown red, in its place on the network,
with the devices downstream of it on the line also affected. Together,
the two views gave the complete picture: valve-island-2 had lost its
incoming link (from the buffer) and its position explained the
downstream loss (from the topology). This directed him to
valve-island-2’s incoming link, where he found and fixed the fault.
Using both views together had given a clear, complete diagnosis. This
scenario shows the buffer and topology views combining for a complete
diagnosis. Understanding how to use both views — the buffer for what and
when, the topology for where — gave the technician the complete picture
directing him to the fault. It reinforces that using the buffer and
topology together provides the full story (what, when, and where),
directing the diagnosis. The scenario reinforces reading the diagnostics
with both views: the technician reached a clear diagnosis by combining
the buffer’s naming and timing of the fault with the topology’s
placement of it, illustrating how the two views complement each other —
what-and-when plus where — to give the complete picture that directs you
straight to the faulty link, which is the core method of letting the
network’s diagnostics tell you what is wrong.
Correlating diagnostics with the HMI and process
A valuable technique is correlating the network diagnostics with the
HMI alarms and the process behavior, because bringing these together
gives a fuller understanding of a fault’s impact and cause. The network
diagnostics (buffer, topology) tell you the network-level fault; the HMI
alarms tell you the operator-level symptom; and the process behavior
tells you the machine-level effect. Correlating them — matching the
network fault to the alarm to what the machine did — gives the complete
picture: a device failing on the network (diagnostics) caused a
particular alarm (HMI) and stopped a particular part of the machine
(process). This correlation helps confirm the diagnosis (the pieces fit)
and understand the impact (what the network fault meant for the
machine). So correlating the diagnostics with the HMI and process
deepens your understanding beyond the network level alone. Understanding
how to correlate diagnostics with the HMI and process — matching network
fault, alarm, and machine effect — gives a fuller picture of a fault.
Understanding how to correlate the network diagnostics with the HMI
alarms and the process behavior — matching the network-level fault to
the operator-level alarm to the machine-level effect — gives a fuller
understanding of a fault, so that you see how a device’s network failure
caused a specific alarm and a specific machine effect, which confirms
the diagnosis by showing the pieces fit together and clarifies the
fault’s impact, bringing the network diagnostics into relation with what
the operator saw and what the machine did for a complete understanding
rather than a network-level view alone.
Letting the network tell its story
To close, it helps to frame reading diagnostics as letting the
network tell its own story, because this framing captures the mindset
that makes diagnostic-reading effective. The network, through its buffer
and topology, is continually recording and reporting its faults — it has
a story to tell about what happened, when, and where. The skill of
reading diagnostics is really the skill of listening to that story:
reading the buffer’s events in sequence, seeing the topology’s
placement, letting the network’s own record inform you rather than
guessing. So the mindset is to let the network tell its story: to
approach a fault by asking what the network’s diagnostics report, and to
read that report as a coherent account of the fault. This framing — the
network telling its story, you listening — captures the essence of
effective diagnostic-reading. Understanding reading diagnostics as
letting the network tell its story — listening to its recorded account
rather than guessing — captures the effective mindset. Understanding
reading diagnostics as letting the network tell its own story —
approaching a fault by listening to what the buffer and topology report,
reading the events in sequence and the placement in context as a
coherent account rather than guessing — captures the mindset that makes
diagnostic-reading effective, so that you treat the network as
continually recording and reporting its faults with a story to tell, and
you make your job the listening to that story, which is the essence of
the ‘let the network talk’ principle and the mindset that turns the
network’s rich diagnostics into an effective diagnosis.