Switches and ports are the junctions of the PROFINET network — where
cables meet and data is directed — and understanding them, especially
the status LEDs at each port, gives you a powerful first diagnostic that
needs no laptop. Many PROFINET devices contain built-in switches, and
every port has status indicators that tell you a great deal at a glance.
This chapter covers switches and ports from the maintenance perspective,
focusing on reading their status.
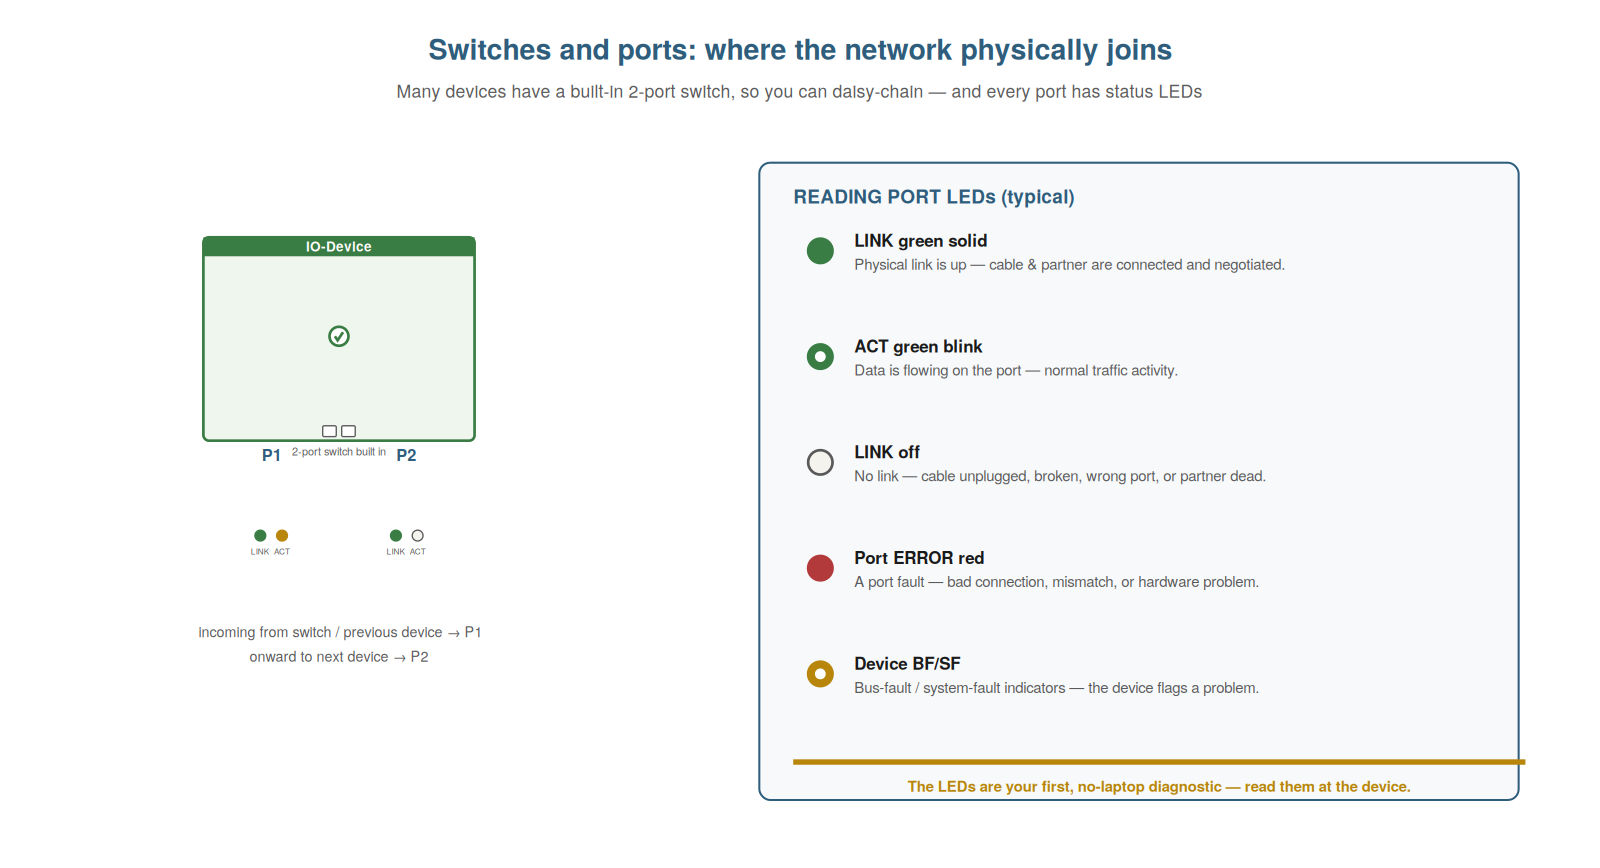
2-port switch for daisy-chaining, and every port has status LEDs.
Reading the LINK and activity LEDs — and any error or bus-fault
indicators — is your first, no-laptop diagnostic, right at the
device.
Switches and the built-in two-port switch
Understanding switches — including the two-port switches built into
many devices — clarifies how the network is physically joined and how
faults propagate. A switch directs network traffic between its ports,
connecting the devices plugged into it. In a star topology, a central
switch connects the devices. But importantly, many PROFINET devices have
a built-in two-port switch, which is what allows line (daisy-chain)
topologies: the data comes into one port, and the device passes it on
through the other port to the next device in the chain. So a line
topology is really a series of built-in two-port switches passing data
along. This matters for diagnosis: in a line, each device’s built-in
switch is part of the path to the devices beyond it, so a device or its
ports failing can affect everything downstream (the data can no longer
pass through). Understanding switches and the built-in two-port switch —
how they join the network and pass data along a line — clarifies the
physical paths and fault propagation. It reinforces that switches direct
traffic and that built-in two-port switches enable line topologies by
passing data device-to-device, so a device in a line is part of the path
to those beyond it. Understanding switches and the built-in two-port
switch — how switches join the network and how the two-port switches in
devices pass data along a daisy-chain — clarifies the physical paths
through the network and how faults propagate, so that you understand
why, on a line, a device or port failure can cut off everything
downstream (the data can no longer pass through that device’s built-in
switch), which is essential for interpreting the pattern of lost devices
on a daisy-chained network.
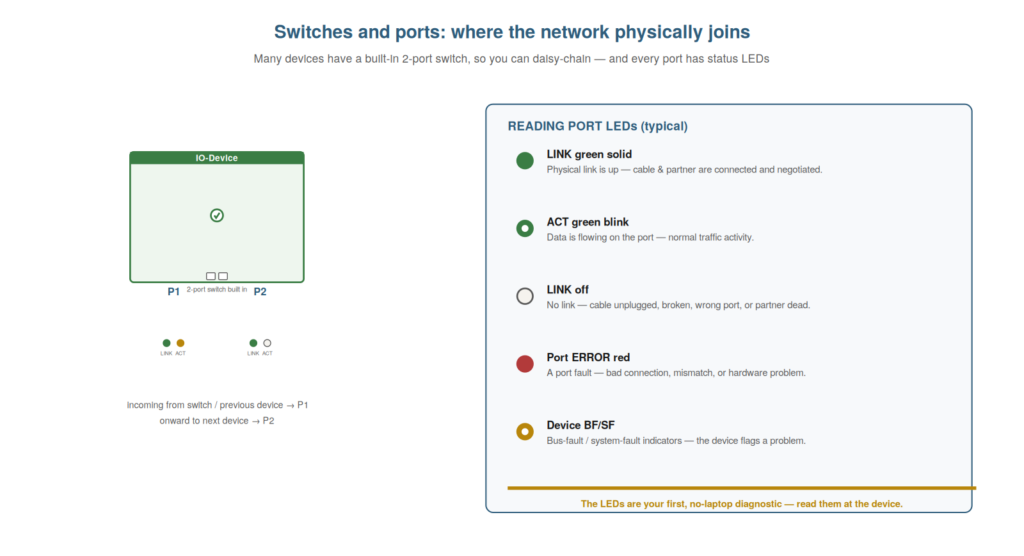
Reading the port LEDs
The single most useful no-laptop diagnostic in PROFINET is reading
the port status LEDs, and understanding what they tell you lets you
assess much of the network’s health right at the machine. Each port
typically has a LINK LED (indicating a physical link is established) and
often an activity indication (showing data is flowing). A solid LINK LED
means the physical connection is good — the cable and the partner device
are connected and communicating at the link level. A LINK LED that is
off means no link: the cable is unplugged, broken, in the wrong port, or
the partner is dead. Activity indication (often the LINK LED blinking)
shows traffic flowing, which is normal. Devices also often have overall
status LEDs — like bus-fault (BF) and system-fault (SF) indicators —
that flag network or device problems. So by reading the port and status
LEDs, you learn a great deal without any tool: which links are up, where
data is flowing, and whether the device is flagging a fault.
Understanding how to read the port LEDs — LINK, activity, and fault
indicators — gives you a powerful first diagnostic at the machine. It
reinforces that the port LEDs (LINK, activity) and device status LEDs
(bus-fault, system-fault) tell you much about the network’s health at a
glance, without a laptop. Understanding how to read the port LEDs — the
LINK LED for a physical connection, activity for data flow, and the
bus-fault and system-fault indicators for problems — gives you a
powerful first diagnostic right at the machine, so that before ever
opening a laptop you can assess which links are up, where data flows,
and whether a device is flagging a fault, which often points you
straight to a physical problem (a dark LINK LED meaning a broken or
unplugged cable) and makes reading the LEDs the sensible first step in
any PROFINET diagnosis.
What the LEDs point to
Beyond reading the LEDs, understanding what specific LED states point
to turns them into a diagnostic that directs your next step. A dark LINK
LED points to a physical connection problem on that port: check the
cable, the connector, whether it is in the right port, and whether the
partner device has power — a physical investigation. A LINK LED that
flickers rather than staying solid points to a marginal or intermittent
physical connection — a poor connector, a damaged cable, or noise —
suggesting a physical fault that comes and goes. A lit bus-fault
indicator points to a network communication problem for that device (it
has lost or not established its data exchange), directing you to why its
communication failed. A system-fault indicator points to a device-level
problem. So each LED state directs a specific next step: dark LINK to
the physical connection, flickering LINK to an intermittent physical
fault, bus-fault to the communication, system-fault to the device.
Understanding what the LEDs point to — translating each state into a
next step — makes them a directing diagnostic. It reinforces that
specific LED states point to specific problems (dark LINK to physical,
flickering to intermittent physical, bus-fault to communication,
system-fault to device), directing the next step. Understanding what the
LEDs point to — translating a dark LINK LED into a physical-connection
check, a flickering LINK into an intermittent-physical suspicion, a
bus-fault into a communication investigation, and a system-fault into a
device problem — turns reading the LEDs into a diagnostic that directs
your next step, so that the LEDs not only tell you something is wrong
but point you toward where to look, which is what makes them such a
valuable and immediate first diagnostic for the maintenance technician
standing at the machine.
Managed versus unmanaged switches
A distinction among switches worth understanding is between managed
and unmanaged switches, because it affects the diagnostics available and
how the network behaves. An unmanaged switch simply passes traffic
between its ports with no configuration or diagnostics — it works, but
it tells you nothing and offers no control. A managed switch, by
contrast, can be configured and provides diagnostics: port statistics,
status information, and features that support PROFINET (like
prioritizing the real-time traffic). For a PROFINET network, managed
switches (or the device built-in switches, which are managed) are
preferred because they provide the diagnostics and behavior the network
needs; an unmanaged switch in the wrong place can be a blind spot (no
diagnostics) or even cause problems (not handling the real-time traffic
properly). So understanding managed versus unmanaged switches clarifies
what diagnostics you can get and why managed switches suit PROFINET.
Understanding the distinction — managed switches offering configuration
and diagnostics, unmanaged offering neither — clarifies the diagnostics
available and why managed switches suit PROFINET, so that you recognize
a managed switch as a source of port statistics and status (a diagnostic
asset) and an unmanaged switch as a blind spot that may also mishandle
real-time traffic, which matters both for diagnosing the network and for
understanding why PROFINET networks favor managed switches that support
the real-time communication and provide the diagnostics troubleshooting
relies on.
Scenario: the LED that told the story
A scenario shows the port LEDs providing an immediate diagnosis. A
device was reported failed, and before opening any laptop, the
technician walked to the device and looked at its LEDs. The LINK LED on
the incoming port was dark, and the bus-fault LED was lit — the story
was already clear: no physical link on that port, so the device had lost
communication. This pointed straight to a physical problem on that link.
He checked the cable and connector, found the connector had vibrated
loose, reseated it, and watched the LINK LED come on and the bus-fault
LED clear as the device returned. The LEDs had diagnosed the fault — a
physical connection problem — without any tool, in moments. This
scenario shows the port LEDs providing an immediate, no-laptop
diagnosis. Understanding how to read the LEDs let the technician
diagnose a physical link fault at the machine, without a tool, in
moments. It reinforces that the port and status LEDs provide an
immediate diagnosis at the machine, pointing a dark LINK and lit
bus-fault straight to a physical problem. The scenario reinforces the
power of reading the LEDs first: the technician diagnosed a failed
device as a loose connector purely from the LEDs — a dark LINK and lit
bus-fault — without any laptop, illustrating why reading the port LEDs
is the sensible first step, often revealing a physical fault immediately
and saving the time of connecting a tool to learn what the LEDs already
showed.
Port mirroring for analysis
An advanced switch feature useful for deep diagnosis is port
mirroring, and understanding it helps when you need to analyze traffic
with a network analyzer. A managed switch can often mirror the traffic
of one port to another — copying the frames passing through a port of
interest to a port where you have connected an analyzer — so you can
capture and examine that traffic without disturbing it. This is valuable
for the hard cases where you need a network analyzer to diagnose load,
timing, or tricky problems: port mirroring lets you tap into the traffic
at a specific point. You will not need this often, but when a fault
requires analyzing the actual frames, knowing that a managed switch can
mirror a port to your analyzer is the enabling technique. So
understanding port mirroring — copying a port’s traffic to an analyzer —
helps with deep traffic analysis. Understanding port mirroring for
analysis — a managed switch copying a port’s traffic to where an
analyzer is connected — helps with the deep diagnosis that needs a
network analyzer, so that when a hard fault requires examining the
actual frames at a specific point, you can use a managed switch’s port
mirroring to tap that traffic into your analyzer without disturbing it,
which is the enabling technique for the occasional deep analysis of
load, timing, or tricky problems that the specialist network analyzer
addresses, rounding out your understanding of how to get at the traffic
when a fault demands it.
Making the LEDs your habit
To close, it is worth crystallizing the habit this chapter builds:
looking at the LEDs first, at the machine, before anything else, because
this habit gives you an immediate diagnostic that often resolves the
fault or points the way. The device and port LEDs report so much — link,
activity, faults — immediately and without a laptop, that making ‘look
at the LEDs first’ a habit means you start every diagnosis with a free,
instant read of the network’s health at the machine. Often the LEDs
alone reveal the fault (a dark link) or point clearly to the area,
saving the time of connecting a tool. So making the LEDs your habitual
first look is a high-value practice that starts every diagnosis with the
simplest, fastest diagnostic. This is why the chapter emphasizes them:
they are the first, easiest step, and a good habit to build.
Understanding to make the LEDs your habit — looking first at the machine
— starts every diagnosis with an immediate, free diagnostic.
Understanding to make the LEDs your habit — looking at the device and
port LEDs first, at the machine, before connecting any tool — starts
every diagnosis with an immediate, free read of the network’s health, so
that you build the high-value habit of beginning at the machine with the
LEDs, which often reveals the fault or points to its area without a
laptop and always gives you a fast first orientation, making the
LEDs-first habit one of the simplest and most effective practices in
PROFINET troubleshooting and a natural starting point for every
fault.