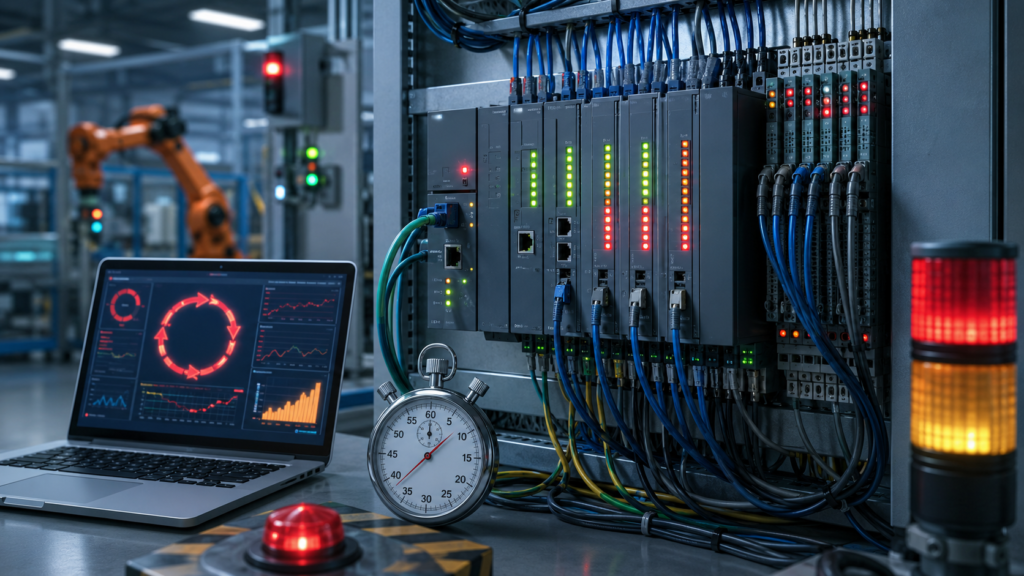
The machine still runs. No red lights, no obvious wiring fault, and the CPU remains in RUN.
Yet something feels wrong.
An input changes, but the output reacts a little late. The HMI becomes sluggish. A motion sequence occasionally misses its expected timing. Then you open the diagnostics in TIA Portal and notice it: the PLC cycle time is far higher than it used to be.
Sometimes it is only a few extra milliseconds. Sometimes it jumps all over the place like a loose cable in a vibrating cabinet. And occasionally, the maximum permitted cycle time is exceeded altogether.
A long Siemens PLC cycle time is usually not caused by one spectacular programming mistake. More often, it is the combined weight of several smaller problems: a loop that processes too much data, a communication block being called constantly, an interrupt running more often than expected, and half the machine program executing even while the equipment is idle.
Individually, these things may look harmless. Together, they can make the CPU crawl.
What Does PLC Cycle Time Actually Mean?
A Siemens PLC does not execute the program once and then sit around waiting. While the CPU is in RUN mode, it repeatedly processes its cyclic program.
In simplified terms, the controller:
- Reads or updates process information.
- Executes the cyclic program, usually beginning with the main program-cycle OB.
- Updates outputs and performs operating-system tasks.
- Starts the next cycle.
The cycle time is not simply the execution time of OB1. Siemens defines it as the time required to execute the cyclic program together with the program sections and system activities that interrupt or accompany that cycle. Communication services, process-image handling and higher-priority OBs can therefore affect the final measurement. This is why two consecutive scans may not take exactly the same amount of time.
A cycle that normally takes 4 ms might occasionally take 7 ms. That is not automatically a fault. The real concern is a cycle time that is consistently too long, varies wildly, or approaches the configured maximum cycle-monitoring time.
Why High Cycle Time Matters
A slow scan does not always stop the machine immediately. That is what makes the problem easy to ignore.
The consequences often appear gradually:
- Slower input-to-output response
- Delayed interlocks
- Sluggish HMI updates
- Unstable communication
- Poor motion or positioning performance
- Timing inconsistencies
- Missed short-duration signals
- Maximum-cycle-time faults
- CPU transitions to STOP in serious cases
The CPU monitors the cyclic program against a configured maximum cycle time. When this limit is exceeded, the controller can request the time-error OB, normally OB80. The exact CPU response depends on the controller family, firmware and whether the required error OB is available, but repeated or unhandled cycle-time overruns can ultimately place the CPU in STOP.
Simply increasing the maximum permitted cycle time may prevent the immediate fault message, but it does not make the PLC faster. That is like turning up the temperature limit on an overheating motor instead of fixing the blocked cooling fan. The alarm disappears. The underlying trouble does not.
1. Large or Poorly Controlled Loops
Loops are useful. They are also one of the easiest ways to quietly destroy PLC performance.
A FOR, WHILE or REPEAT loop may process arrays, recipes, alarm histories, production data or communication buffers. With ten elements, the execution cost is usually trivial. With ten thousand elements, called every scan, things get rather less charming.
The danger becomes greater when the number of loop iterations is calculated during runtime.
For example:
FOR #Index := 0 TO #NumberOfRecords DO
    #Total := #Total + #ProductionData[#Index].Value;
END_FOR;
If #NumberOfRecords unexpectedly becomes much larger than intended, the PLC suddenly has far more work to complete during that scan.
A WHILE loop is riskier still because it depends on a condition becoming false:
WHILE #SearchComplete = FALSE DO
    // Search operation
END_WHILE;
When the exit condition is incorrect, delayed or never reached, the CPU can remain inside the loop until the cycle watchdog intervenes.
How to fix large loops
Start by limiting the maximum number of iterations. Never allow an operator value, communication value or calculated variable to create an effectively unlimited loop.
Where possible, split large tasks across several PLC scans. Instead of processing 5,000 records in one cycle, process perhaps 50 records per scan while retaining the current array index.
It takes longer to complete the overall job, yes, but the machine remains responsive while it happens.
Also ask a brutally simple question: does the entire array need to be processed every scan?
Often, it does not. A recipe table may only need validation when a recipe changes. Historical data may only need sorting when a new batch is completed. Running the same heavy calculation thousands of times per second is mostly an excellent way to keep the CPU busy doing nothing useful.
2. Excessive Communication Load
Modern Siemens PLCs rarely operate alone. They exchange data with HMIs, SCADA systems, variable-frequency drives, remote I/O, barcode readers, vision systems, databases, OPC UA clients and other PLCs.
Some machines appear to be running a small corporate IT department inside the control cabinet.
Communication requires CPU time. Siemens CPUs allow part of the available processing capacity to be assigned to communication tasks, and high communication load can lengthen the cyclic program time—particularly when it is combined with higher-priority OB activity. Siemens’ own cycle-time documentation illustrates that communication and interrupt load can significantly increase the total cycle duration.
Common causes include:
- Too many HMI tags being refreshed rapidly
- Several engineering stations monitoring the PLC
- Large PUT/GET transfers
- Frequent OPC UA reads
- Communication blocks called every scan
- Repeated record reads and writes
- Large data blocks transferred unnecessarily
- Faulty devices repeatedly reconnecting
- Diagnostic requests running continuously
- Multiple SCADA clients polling the same variables
One HMI screen requesting hundreds of values at a very fast refresh rate may be enough to create noticeable load on a smaller CPU. Add online monitoring from TIA Portal, a historian and a remote support connection, and the scan-time graph may begin to resemble mountain terrain.
How to reduce communication load
Do not transfer data faster than the application needs it.
A motor-running indication may need a fast update. A maintenance counter showing total operating hours probably does not need to refresh every 100 ms.
Group related data into structured communication areas instead of issuing many scattered requests. Send information only when it changes, where the protocol and application allow it. Avoid calling asynchronous communication instructions continuously without respecting their BUSY, DONE and ERROR states.
It is also worth testing the machine with nonessential clients disconnected. Close extra TIA Portal sessions, temporarily disable historian polling and reduce HMI refresh rates. When the PLC cycle time immediately drops, you have found an important clue.
3. Inefficient Data Processing
Not every line of PLC code costs the same amount of execution time.
Moving a Boolean value is cheap. Searching a large array, sorting records, converting long strings, copying oversized structures or repeatedly performing floating-point calculations is heavier.
The problem is rarely one individual calculation. It is repetition.
Imagine a block that scans 500 alarm records, converts several values to strings and copies a large structure. Perhaps it takes only a fraction of a millisecond. Called once when an alarm report is requested, no drama. Called every scan from three separate locations—now it starts nibbling away at the CPU budget.
Typical examples of inefficient processing include:
- Sorting arrays cyclically
- Searching entire datasets for one value
- Repeated string concatenation
- Converting the same values every scan
- Copying complete structures when only one field changed
- Running identical calculations in several blocks
- Reading recipe or archive data continuously
- Recalculating engineering values that have not changed
- Processing inactive machine sections
Better ways to handle data
Use event-driven logic where practical.
Calculate a result when one of its source values changes. Validate a recipe after it is loaded. Build an HMI string only when the displayed value changes. Sort records after a new record is added—not 200 times per second merely because the PLC is enthusiastic.
Store reusable results instead of calculating them repeatedly.
You can also divide slower background processing into stages. One scan can perform step 1, the next scan step 2, and so on. A small state machine often handles this neatly without blocking the main cyclic program.
4. Too Many Interrupts
Interrupt OBs are valuable because they allow important tasks to run independently of the normal cyclic program.
They also interrupt it. The hint is rather firmly embedded in the name.
Cyclic-interrupt OBs execute at configured periodic intervals, while hardware and diagnostic interrupt OBs are started by specific events. These OBs generally have a higher priority than the normal program-cycle OB, so their execution delays completion of the interrupted cyclic program.
A short interrupt block running every 100 ms may barely affect the CPU. A complicated block running every 1 ms is a different animal.
Problems appear when:
- Interrupt intervals are unnecessarily short
- Several cyclic interrupts start at similar times
- Large amounts of logic are placed inside interrupt OBs
- Communication instructions are executed from fast interrupts
- Interrupt events occur more frequently than expected
- An interrupt OB does not finish before the next event arrives
- Hardware inputs generate noisy or repeated interrupt events
If a cyclic interrupt is triggered again before its previous execution has completed, a time error can occur. Siemens provides phase-offset settings specifically to help distribute cyclic-interrupt execution rather than allowing several OBs to start simultaneously.
How to optimize interrupts
Keep interrupt OBs lean.
Perform the time-critical action, store the necessary event data, set a flag and leave. Heavier processing can usually be completed later in the normal cyclic program.
Review the configured interval as well. Does a temperature calculation honestly need to run every millisecond? Probably not. Fast timing should be reserved for tasks that genuinely require deterministic, high-speed execution.
When several cyclic interrupts are used, stagger them with phase offsets where appropriate. This spreads the work instead of dumping everything onto the CPU at the same instant.
5. Slow Instructions and Heavy Functions
Certain operations naturally require more processing than simple Boolean logic.
Potentially expensive operations include:
- Complex floating-point mathematics
- Trigonometric functions
- Large memory copies
- String manipulation
- Array searches
- Data sorting
- Record communication
- Serialization and deserialization
- Motion-control calculations
- Repeated system-function calls
- Large block comparisons
This does not mean these instructions are bad. A screwdriver is not bad either; using one to hammer in fifty nails is simply an odd design choice.
Measure before rewriting everything.
For supported Siemens CPUs, the RUNTIME instruction can be used to measure execution time around a block or command sequence. Siemens explains that one call starts the measurement and a later call using the same memory returns the elapsed runtime. The measurement can include interruptions and communication activity occurring during the measured interval.
The RT_INFO instruction can also provide runtime statistics for specific organization blocks and program or communication activity on supported CPU families.
This is far better than guessing.
A network that looks complicated may execute quickly, while a harmless-looking data-processing block may consume most of the scan. PLC code is occasionally sneaky like that.
6. A Program Block Is Called Unnecessarily Every Scan
This is perhaps the most common cause because it often begins innocently.
A programmer creates a function for recipe validation, alarm-history handling, data logging or initialization. The function works, so it is placed in the normal OB1 call structure.
Months later, it is still being executed every scan—even though the result is needed once per recipe change, once per minute or only during startup.
Examples include:
- Initialization logic running after startup is complete
- Recipe checks running while no recipe has changed
- Data-logging preparation running with logging disabled
- Communication blocks called while the connection is not required
- Manual-mode logic running during automatic operation
- Automatic sequences running while the machine is stopped
- Diagnostics calculations running without a diagnostic request
- HMI formatting code running when the relevant screen is closed
Use conditional execution carefully
Call the block only when it has work to do:
IF #RecipeChanged THEN
    "ValidateRecipe"(Recipe := #CurrentRecipe);
    #RecipeChanged := FALSE;
END_IF;
For machine modules, use an enable condition:
IF #ConveyorEnabled THEN
    "ConveyorControl"(Data := #ConveyorData);
END_IF;
Be careful, though. Function blocks contain internal state. If a block manages timers, edge detection, motion commands or safety-related sequencing, simply skipping its call may freeze its state in an unwanted condition.
Optimization should never come at the cost of predictable machine behaviour. Sometimes the correct solution is to keep calling the block but bypass only its expensive, nonessential processing.
How to Find the Cause in TIA Portal
Do not begin by randomly deleting code. Use a process.
Step 1: Record the normal cycle-time values
Go online with the CPU and review its runtime or cycle-time information. Note the:
- Current cycle time
- Minimum cycle time
- Maximum cycle time
- Average behaviour
- Frequency of large spikes
A steady increase usually suggests growing cyclic workload. Sharp occasional spikes may point toward interrupts, communication bursts, recipe operations or event-triggered calculations.
Step 2: Check the diagnostic buffer
Look for messages involving:
- Maximum cycle time exceeded
- Time error
- OB80 request
- Cyclic interrupt execution
- Communication faults
- Repeated device connection losses
- CPU resource or performance warnings
The diagnostic buffer may reveal when the problem began and which event occurred shortly beforehand.
Step 3: Measure suspicious blocks
Use runtime measurement around:
- Large loops
- Communication routines
- Recipe handling
- Alarm processing
- Data logging
- String operations
- Motion calculations
- Recently modified blocks
Measure during real machine operation. A block may execute quickly while the equipment is idle but become heavy when production data, alarms or communications are active.
Step 4: Temporarily isolate the workload
When it is safe to do so, disable one noncritical section at a time.
Disconnect an optional communication client. Stop an unnecessary cyclic calculation. Prevent one background block from running. Increase an interrupt interval temporarily.
Then observe the cycle time again.
Change one thing at a time, otherwise you may improve the scan without learning what actually caused the improvement.
Step 5: Compare CPU behaviour in different machine states
Check the cycle time while the machine is:
- Idle
- Starting
- Running normally
- Changing recipes
- Handling alarms
- Communicating with all external systems
- Operating in manual mode
- Completing a production batch
A problem that appears only during one state usually points toward the logic activated in that state.
Should You Increase the Maximum Cycle Time?
Sometimes increasing the maximum cycle time is reasonable.
A larger machine program may genuinely require a longer scan, and the existing limit may simply be too restrictive. The maximum setting should reflect the real response-time requirements of the process and the expected worst-case program workload.
But do not use the setting as camouflage.
Before increasing it, confirm:
- The program has no endless or uncontrolled loops
- Interrupts cannot overlap uncontrollably
- Communication load is acceptable
- Worst-case response time remains safe
- Interlocks still respond quickly enough
- The CPU has sufficient performance margin
- The cycle time is stable rather than randomly spiking
If the normal scan is 8 ms and the limit is 10 ms, adjusting the limit may be reasonable after proper testing. If the scan suddenly increased from 8 ms to 150 ms after a program modification, changing the watchdog to 200 ms is not troubleshooting. It is surrender with extra steps.
When a Faster CPU Is the Right Answer
Code optimization has limits.
A program controlling many axes, processing large datasets, serving several communication systems and executing fast control loops may simply need more processing power.
A CPU upgrade becomes worth considering when:
- The program has already been profiled and optimized
- The cycle time remains close to the maximum
- New machine functions are still being added
- Interrupt and communication load cannot be reduced
- The process requires faster response than the current CPU can provide
- The controller has almost no spare performance capacity
Still, profile the program first. Installing a faster CPU without finding a runaway loop merely gives the loop a nicer place to live.
Practical Checklist
When a Siemens PLC cycle time is too high, check the following:
- Are any loops processing excessive amounts of data?
- Can large loops be divided across multiple scans?
- Are
WHILEloops guaranteed to terminate? - Are communication blocks called every scan?
- Is the HMI requesting too many tags too quickly?
- Are several clients connected to the CPU?
- Are large structures copied unnecessarily?
- Are calculations repeated even when values have not changed?
- Are strings processed continuously?
- Are cyclic-interrupt periods too short?
- Do multiple interrupts start at the same time?
- Is too much code running inside higher-priority OBs?
- Are inactive machine sections still being processed?
- Are startup or initialization routines still running?
- Which block consumes the most measured execution time?
- Did the problem begin after a particular program change?
The cure is usually not one clever instruction. It is removing needless work, scan by scan, until the CPU spends its time controlling the machine rather than repeatedly calculating things nobody asked for.