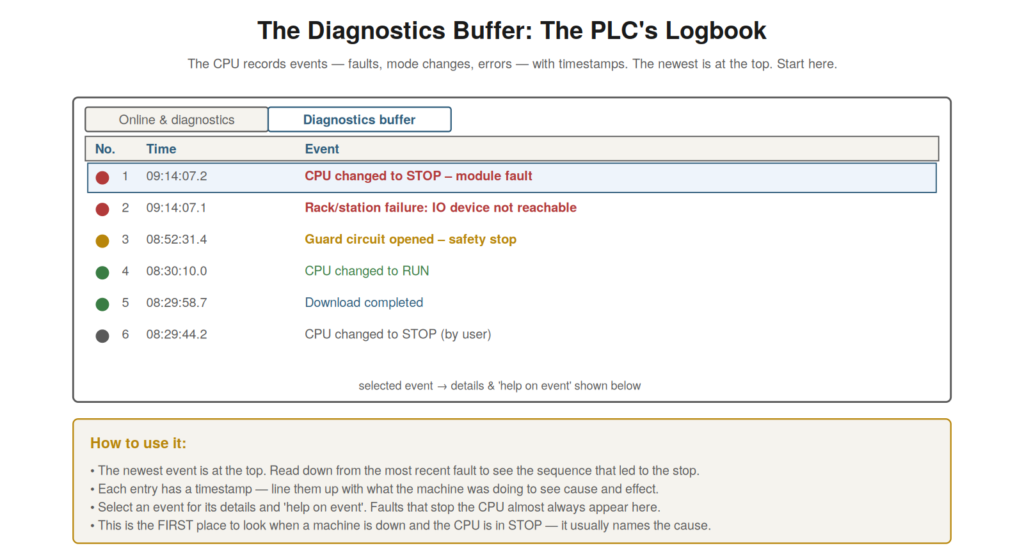
When a machine is down and the CPU has stopped or faulted, the single
most valuable diagnostic tool is the diagnostics buffer — the
controller’s own logbook of events. The CPU records faults, mode
changes, and errors with timestamps, and reading this buffer is usually
the fastest way to find what stopped a machine. For a maintenance
technician, the diagnostics buffer is the first place to look when a CPU
is down, and understanding how to read it is a core diagnostic
skill.
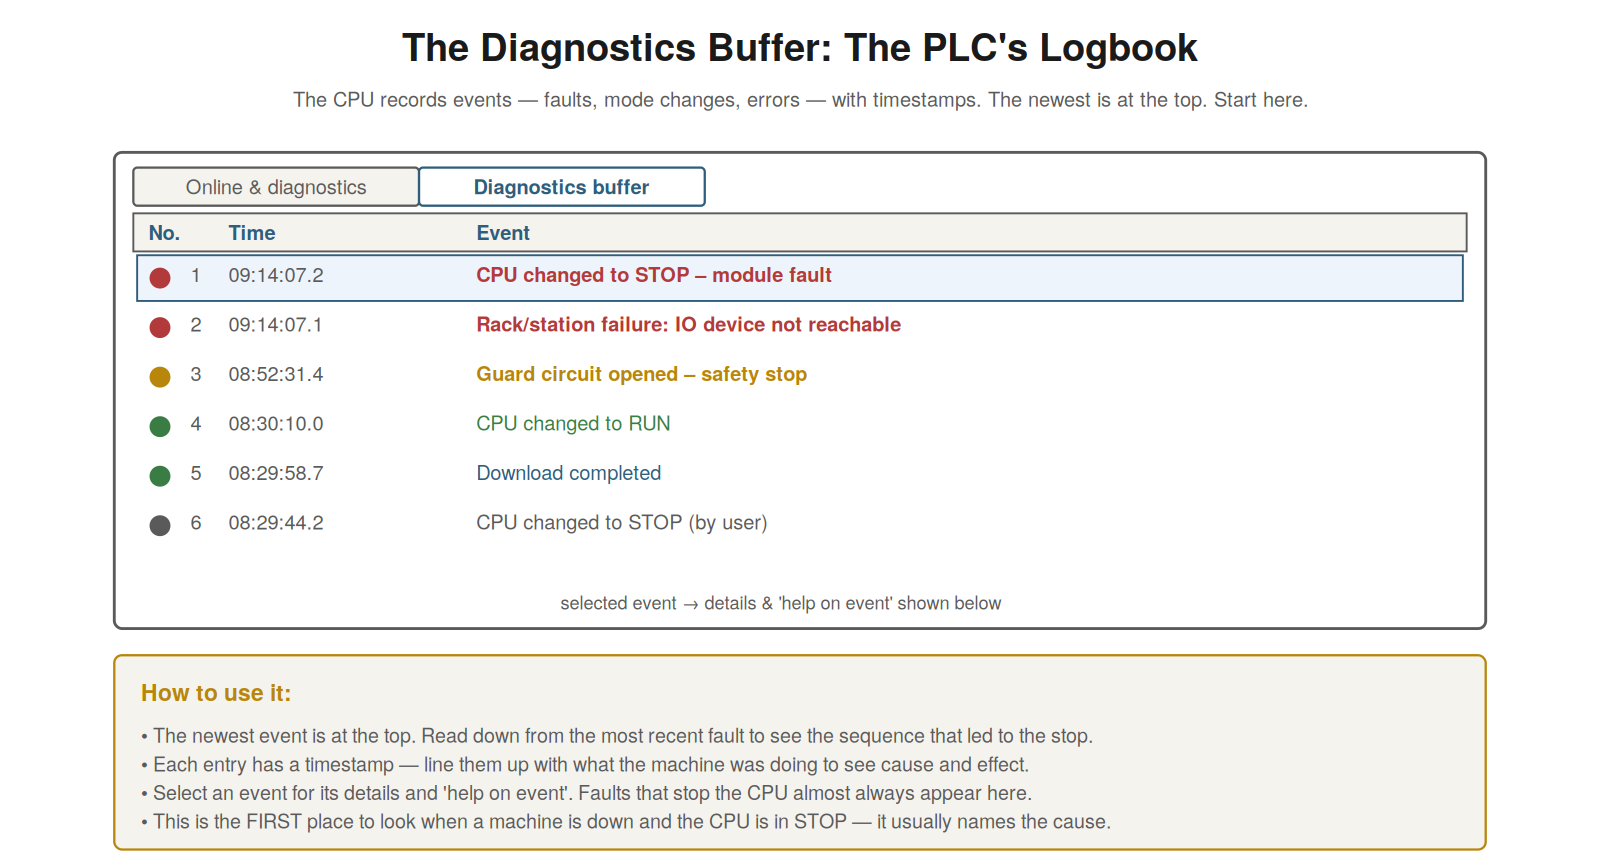
faults, mode changes, and errors, timestamped, newest at the top. When a
machine is down and the CPU is in STOP, this is the first place to look
— it usually names the cause.
What the diagnostics buffer records
The diagnostics buffer records the significant events in the CPU’s
life — a chronological logbook that captures what has happened, which is
invaluable for diagnosis. It records faults (hardware faults,
programming errors, and other problems the CPU detects), mode changes
(the CPU going to RUN or STOP), and other significant events, each with
a timestamp. The newest events are at the top, so the most recent events
— including whatever just went wrong — are immediately visible. When the
CPU stops due to a fault, the fault that caused the stop is recorded
here, usually named clearly. So the diagnostics buffer is a timestamped
record of the CPU’s significant events, especially the faults and mode
changes that matter for diagnosis. Understanding what the buffer records
— faults, mode changes, and events, timestamped, newest first — tells
you what this logbook provides. It reinforces that the diagnostics
buffer is the CPU’s record of significant events, capturing the faults
and mode changes that reveal what happened, with the newest at the top.
Understanding what the diagnostics buffer records — the timestamped log
of faults, mode changes, and events — is the basis for using it, because
this record usually contains exactly what you need when a machine is
down: the fault that stopped it, when it occurred, and the sequence of
events around it, all captured in the CPU’s own logbook that you read to
find what happened.
Reading the buffer to find a cause
Reading the diagnostics buffer to find the cause of a problem follows
a straightforward approach that resolves many down-machine situations
quickly. When a CPU is stopped or faulted, you open the diagnostics
buffer and read from the top (the newest events): the fault that stopped
the CPU is usually at or near the top, named clearly (a module fault, a
programming error, a communication failure). Reading down from the most
recent fault, you can see the sequence of events that led to the stop —
the fault, and what happened just before it — which reveals the cause
and its context. Selecting an event shows its details and often help
explaining it. The timestamps let you correlate the events with what the
machine was doing. So reading the buffer — from the newest fault down,
with details and timestamps — reveals what stopped the machine and the
sequence around it. Understanding how to read the buffer to find a cause
— from the top, following the sequence, using details and timestamps —
is the key diagnostic technique for down machines. It reinforces that
the buffer is read from the newest event down, revealing the fault that
stopped the CPU and the sequence leading to it, usually naming the
cause. Understanding how to read the diagnostics buffer to find a cause
— starting from the most recent fault and following the event sequence —
is the essential first diagnostic step for a down machine, because the
buffer usually names the fault that caused the stop and shows the
context, resolving many down-machine situations by directing you
straight to the recorded cause, which is why the buffer is the first
place to look when a CPU has stopped.
The buffer as your starting point
For any situation where the CPU is down or has faulted, the
diagnostics buffer is your starting point, and understanding its primacy
focuses your diagnosis efficiently. Because the buffer records the
faults that stop the CPU, and does so clearly with timestamps, it is the
most direct source of information about what went wrong — far more
direct than inspecting the program or the machine blindly. So when a
machine is down with the CPU stopped or faulted, the efficient first
action is to go online and read the diagnostics buffer, which usually
tells you the fault directly, focusing all further diagnosis. Only after
reading the buffer — and understanding what it reports — do you proceed
to investigate the named fault (a failed module, a programming error, a
communication problem). Making the buffer your starting point ensures
you begin every down-machine diagnosis with the CPU’s own report of what
happened. Understanding the buffer’s primacy — that it is the starting
point for down-machine diagnosis — focuses your approach. It reinforces
beginning any down-CPU diagnosis at the diagnostics buffer, because it
directly reports the fault that stopped the machine, focusing the
diagnosis from the start. Understanding the diagnostics buffer as your
starting point for down-machine diagnosis — the first place to look,
which usually names the cause — makes your diagnosis efficient,
beginning with the CPU’s own clear report rather than blind
investigation, so that the buffer directs you to the fault and its
context, from which you proceed to investigate and resolve the specific
problem it has identified, making it the essential and efficient
starting point whenever a CPU is down.
Interpreting the events
Getting the most from the diagnostics buffer involves interpreting
the events correctly, and understanding a few points about
interpretation deepens your use of it. The events in the buffer describe
what the CPU detected — but interpreting them into a cause sometimes
takes thought. A single fault event may be the direct cause (a module
failure stopping the CPU), or it may be a consequence of something else
(the CPU stopping because of a fault that a preceding event explains).
So reading the sequence, not just the top event, matters: the events
leading up to a stop tell the story, and the root cause may be a few
events down, with the top events being consequences. Also, selecting an
event gives details and often ‘help on event’, which explains the event
and suggests causes — valuable for interpreting an unfamiliar event.
Understanding how to interpret the events — reading the sequence for the
story, using the details and help, distinguishing cause from consequence
— deepens your use of the buffer. It reinforces that interpreting the
buffer means reading the event sequence and using the details and help,
not just reading the top event, to distinguish the root cause from its
consequences. Understanding how to interpret the diagnostics buffer
events — reading the sequence, using the details and help, and
distinguishing cause from consequence — lets you get the full diagnostic
value from the buffer, understanding not just that a fault occurred but
the story of what led to it, which is how the buffer’s record of events
becomes a clear understanding of what happened and why, using the
sequence and the per-event help to interpret the events into an
understanding of the cause.
Scenario: the buffer told the whole story
A scenario shows the diagnostics buffer telling the story of a stop.
A machine went down with the CPU in STOP, and the technician went online
and opened the diagnostics buffer. Reading from the top, the story was
clear: the newest event showed the CPU going to STOP due to a module
fault; the event just before it named a specific I/O module reporting a
fault; and an event before that showed the onset of the problem. The
timestamps showed it all happened in quick succession. The buffer had
laid out the sequence: a module developed a fault, which caused the CPU
to stop. This pointed straight to the module, whose detailed diagnostics
(in the device view) then specified the exact problem. The buffer had
told the whole story of the stop, directing the diagnosis immediately.
This scenario shows the diagnostics buffer revealing the sequence of a
stop, directing the diagnosis to the faulted module. Understanding how
to read the buffer — from the top, following the sequence — gave the
technician the story of the stop and pointed to the module. It
reinforces that the buffer tells the story of a stop through its
sequence of timestamped events, usually pointing directly to the cause.
The scenario reinforces the buffer’s value as the starting point for a
down machine: reading it from the top gave the technician the whole
sequence — a module fault stopping the CPU — directing the diagnosis
immediately to the module, illustrating why the diagnostics buffer is
the first place to look when a CPU is down, as it usually tells the
story of what happened.
Clearing the buffer and when not to
A practical point about the diagnostics buffer is whether and when to
clear it, and understanding this prevents losing valuable diagnostic
history. The buffer can be cleared (emptied of its events), and there
can be a temptation to clear it — for a fresh start, or to remove old
events. But clearing the buffer loses the history — the record of what
has happened — which is valuable diagnostic information, especially for
intermittent or recurring faults whose pattern is in the history. So
generally you should not clear the buffer without reason, preserving its
history. If you do clear it (perhaps after resolving a problem and
wanting a clean slate to see if it recurs), do so deliberately,
understanding you are discarding the history. Usually, the buffer’s
automatic management (it keeps a rolling history, overwriting the oldest
when full) is fine, and manual clearing is unnecessary and risks losing
useful information. Understanding clearing the buffer and when not to —
that clearing loses valuable history — prevents discarding useful
diagnostic information. Understanding whether and when to clear the
diagnostics buffer — recognizing that clearing loses the valuable
history of events — prevents the mistake of discarding useful diagnostic
information, so that you generally preserve the buffer’s history
(especially valuable for intermittent and recurring faults) rather than
clearing it needlessly, clearing only deliberately when you have a
reason and understand you are discarding the record, which protects the
diagnostic history that the buffer accumulates and that is often key to
diagnosing recurring or intermittent problems.
The buffer as the machine speaking
Consolidating the diagnostics-buffer material, the buffer is, in
effect, the machine telling you what happened — its own record of its
faults and events — and appreciating it this way emphasizes making it
your first recourse. Rather than having to infer what went wrong, you
have the CPU’s own account: the buffer records the faults and events, so
the machine, through the buffer, tells you what happened. This is
enormously valuable — it is the most direct information available about
a fault, coming from the CPU itself. So making the buffer your first
recourse when a machine is down — letting the machine speak before you
investigate further — is the efficient, sensible approach. The buffer
usually tells you the fault directly, saving much investigation. So
treating the buffer as the machine speaking, and listening to it first,
is the wise diagnostic habit. Understanding the buffer as the machine
speaking — its own account of what happened — emphasizes making it your
first recourse. Understanding the diagnostics buffer as the machine
speaking — its own record of the faults and events it experienced, the
most direct account of what happened — emphasizes making it your first
recourse when a machine is down, so that you let the machine tell you
what happened (through the buffer) before investigating further, which
is the efficient, sensible approach because the buffer usually names the
fault directly, making it wise to listen to the machine’s own account
first rather than inferring what went wrong, and treating the
diagnostics buffer as the machine speaking to you about its faults.