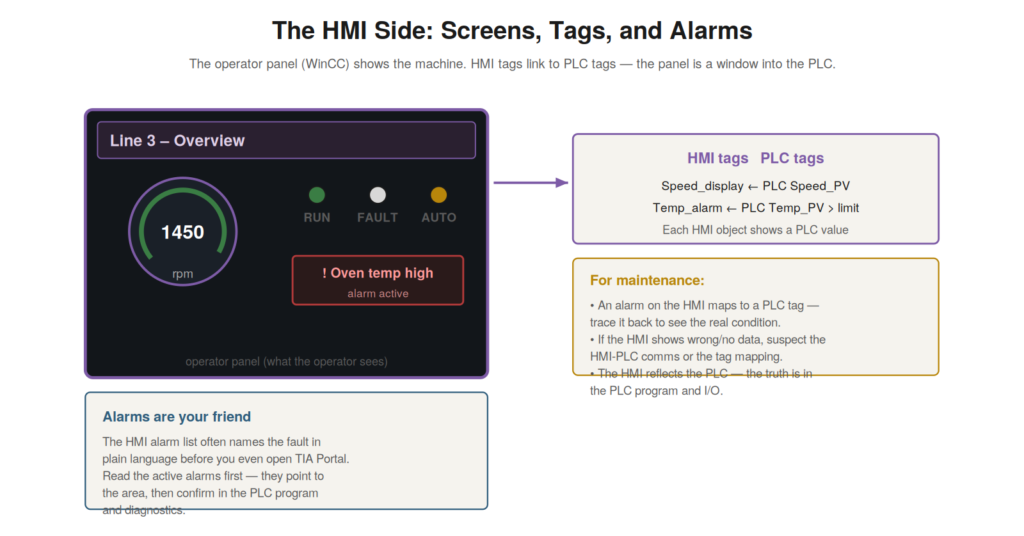
Most machines have a human-machine interface — an operator panel —
configured in TIA Portal with WinCC, and understanding the HMI side
helps you both use its information for diagnosis and troubleshoot the
HMI itself. The HMI shows the operator the machine’s state and alarms,
and its data comes from the PLC, so the HMI is a window into the PLC
that both aids diagnosis (through its alarms) and can itself have
problems. This chapter covers the HMI from the maintenance
perspective.
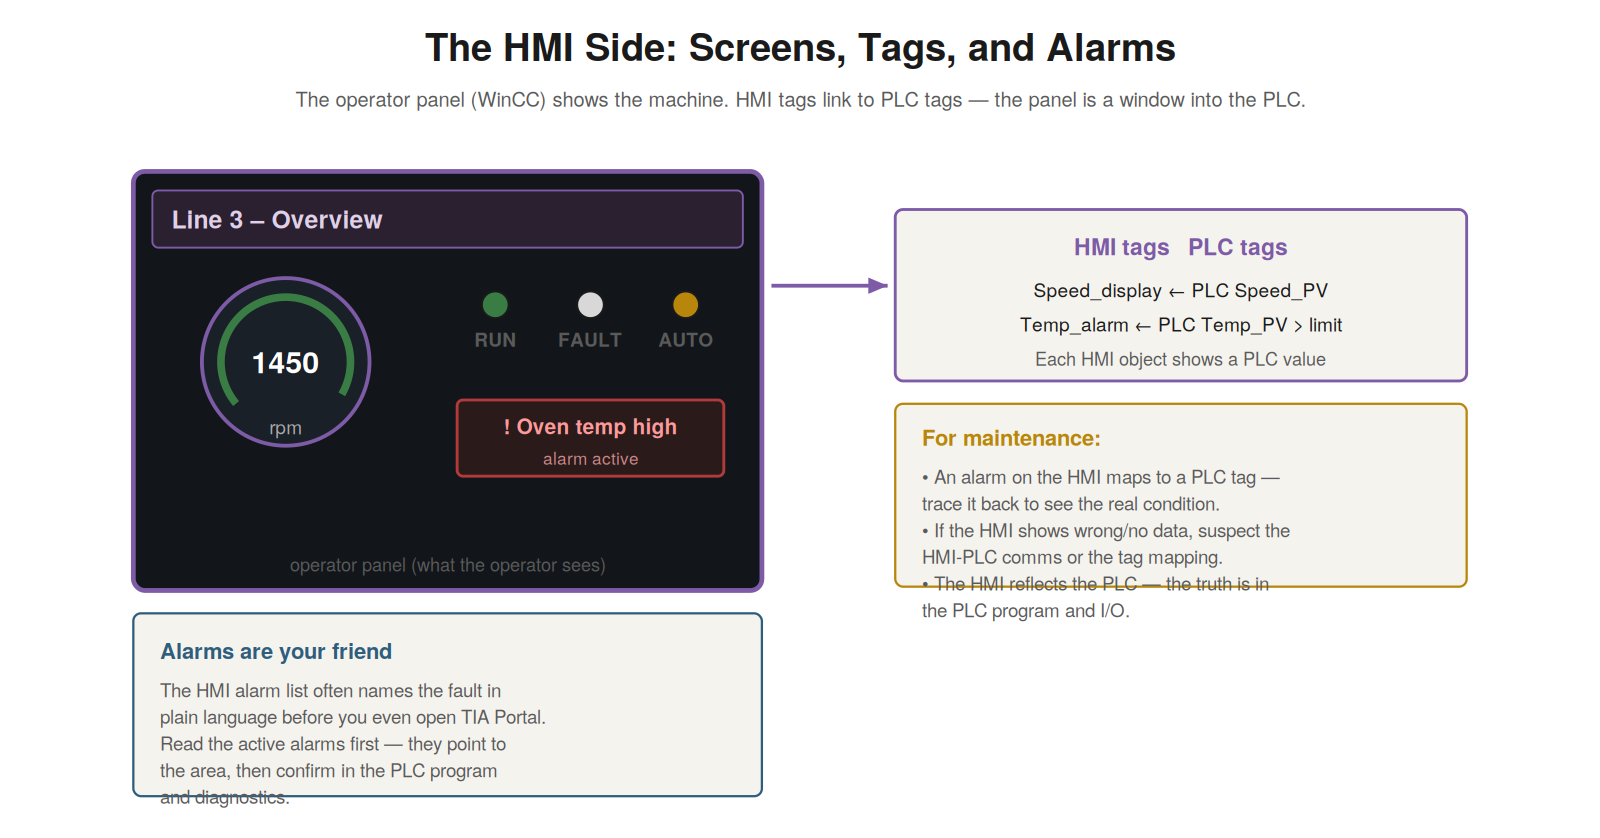
machine, with HMI tags linked to PLC tags. Alarms often name the fault
in plain language — read them first. If the HMI shows wrong or no data,
suspect the HMI-PLC connection or tag mapping.
The HMI as a window into the PLC
The HMI is fundamentally a window into the PLC — it displays PLC
values and states — and understanding this relationship clarifies both
how to use it and how to troubleshoot it. The operator panel shows
information about the machine: speeds, temperatures, states, alarms.
This information comes from the PLC: HMI tags are linked to PLC tags, so
each HMI display element shows a PLC value. The HMI does not itself know
the machine’s state; it reflects what the PLC tells it. So the HMI is a
window into the PLC, displaying PLC values in an operator-friendly form.
This means the truth is in the PLC — the HMI reflects it — so for
diagnosis, the HMI’s information points back to PLC values, and HMI
problems (wrong or missing data) often trace to the HMI-PLC link.
Understanding the HMI as a window into the PLC — displaying PLC values
via linked tags — clarifies its role. It reinforces that the HMI
reflects PLC values through linked tags, so its information comes from
and points back to the PLC, where the truth lies. Understanding the HMI
as a window into the PLC — reflecting PLC values rather than being the
source of truth — clarifies how to use it (its displays point back to
PLC values) and how to troubleshoot it (problems often lie in the
HMI-PLC link or the PLC itself), so that you treat the HMI as a view of
the PLC, using its information while understanding that the underlying
reality is in the PLC program and I/O that the HMI merely displays.
Alarms: reading them first
The HMI’s alarms are among the most useful diagnostic information
available, often naming a fault in plain language before you even open
the program — so reading them first is efficient. The HMI typically
displays alarms: messages generated when fault conditions occur, often
in plain, descriptive language (‘Oven temperature high’, ‘Guard door
open’, ‘Motor overload’). These alarms name or describe the problem
directly, pointing to the area to investigate, and they are visible
right on the operator panel without any TIA Portal work. So reading the
active alarms first — at the HMI — often tells you the problem or at
least the area, before deeper investigation. Each alarm maps to a PLC
condition (a tag or logic), so you can then trace it back into the PLC
to see the real condition. Understanding the value of alarms —
plain-language fault descriptions on the HMI, read first — makes them an
efficient diagnostic starting point. It reinforces that the HMI alarms
often name the fault in plain language, making reading them first an
efficient way to identify the problem or area, then traceable back into
the PLC. Understanding the HMI alarms as a valuable, plain-language
diagnostic — read first, before deeper investigation — gives you an
efficient starting point, because the alarms often tell you what is
wrong directly, pointing to the area to investigate and saving time, so
that reading the active HMI alarms is often the quickest first step in
diagnosing a fault, providing a plain-language description that then
guides the deeper investigation in the PLC program and diagnostics.
Troubleshooting the HMI itself
Sometimes the HMI itself has problems — showing wrong or no data —
and understanding how to troubleshoot these, based on the HMI-PLC
relationship, resolves them. If the HMI shows no data or wrong data
(values not updating, blank fields, obviously wrong readings), the
problem is usually in the link between the HMI and the PLC, or the tag
mapping, rather than the PLC’s actual values. Common causes: the HMI-PLC
communication is down (a network or connection problem), the tag mapping
is wrong (an HMI tag not correctly linked to its PLC tag), or the
connection configuration is faulty. So troubleshooting HMI display
problems focuses on the HMI-PLC connection and the tag mapping —
checking the communication status, the network, and whether the tags are
correctly linked. If the PLC’s values are correct (verified in the PLC)
but the HMI shows them wrong, the problem is in the HMI or its link, not
the PLC. Understanding how to troubleshoot the HMI — focusing on the
HMI-PLC connection and tag mapping for display problems — resolves these
issues. It reinforces that HMI display problems (no or wrong data)
usually lie in the HMI-PLC communication or tag mapping, checked by
verifying the connection and the tag links, distinguishing an HMI
problem from a PLC one. Understanding how to troubleshoot the HMI itself
— suspecting the connection and tag mapping when it shows wrong or no
data — completes the HMI-side skills, letting you resolve display
problems by checking the HMI-PLC link and mapping, and distinguish a
genuine HMI problem (the display) from a PLC problem (the underlying
value), based on the understanding that the HMI reflects PLC values
through a connection and tag mapping that can themselves fail.
Alarms map to the program
A useful understanding is exactly how HMI alarms map back to the
program, because this lets you trace an alarm to its real cause. An HMI
alarm is triggered by a condition in the PLC — typically a tag (an alarm
bit) that the program sets when the fault condition occurs. So each
alarm corresponds to a PLC tag, and that tag is set by some logic — the
logic that detects the fault condition. To trace an alarm to its cause,
you find the tag behind the alarm (from the HMI’s alarm configuration or
the tag name), then use cross-references to find where that tag is set
in the program — which is the logic detecting the fault, revealing the
real condition. So an alarm is not a dead end but a pointer into the
program: alarm to tag to the logic that sets it to the real condition.
Understanding how alarms map to the program — alarm to PLC tag to the
setting logic to the real condition — lets you trace an alarm to its
cause. It reinforces that HMI alarms correspond to PLC tags set by
logic, so you can trace an alarm back through its tag to the logic and
condition that cause it. Understanding that alarms map to the program —
each alarm to a tag, set by logic that detects a real condition — lets
you trace an alarm from the HMI back into the PLC to find its true
cause, using cross-references to find where the alarm’s tag is set,
which reveals the actual fault condition behind the alarm, turning the
plain-language HMI alarm into a starting point for tracing the real
cause in the program rather than just a message on a screen.
Scenario: the alarm named the fault
A scenario shows an HMI alarm giving a diagnostic head start. A
machine had stopped, and before even opening TIA Portal, the technician
looked at the operator panel, which displayed an active alarm in plain
language: ‘Zone 2 guard door open’. This named the problem directly — a
guard door in zone 2 was open (or reading as open), stopping the machine
for safety. The alarm had pointed straight to the area and condition.
Going to that guard door, the technician found it slightly ajar; closing
it properly cleared the alarm and let the machine restart. The HMI alarm
had given a diagnostic head start, naming the fault before any deeper
investigation. Had they gone straight to TIA Portal without reading the
alarm, they would have taken longer to reach what the alarm stated
plainly. This scenario shows an HMI alarm naming the fault, giving a
head start. Understanding to read the HMI alarms first let the
technician get the plain-language fault (‘guard door open’) immediately,
pointing to the area and condition. It reinforces that HMI alarms often
name the fault in plain language, making reading them first an efficient
head start. The scenario reinforces reading HMI alarms first: the
plain-language alarm named the fault (a guard door open), giving the
technician a head start straight to the cause, illustrating how the HMI
alarms, read first, often tell you what is wrong before any deeper
investigation, which is why they are such an efficient diagnostic
starting point.
Alarm history and logging
A valuable HMI feature for diagnosis is the alarm history or log, and
understanding it helps you diagnose faults that have already cleared or
that follow a pattern. Many HMIs log alarms — keeping a history of the
alarms that have occurred, with timestamps — not just showing currently
active ones. This alarm history is valuable diagnostically: for a fault
that has cleared, the history shows it occurred and when; for a
recurring or intermittent problem, the history reveals the pattern of
occurrences; and for understanding a sequence of events, the timestamped
alarm log lays it out. So the alarm history, like the diagnostics
buffer, provides a record over time — here of the alarms — useful for
faults not currently present or for seeing patterns. Checking the alarm
history complements the currently active alarms with the historical
record. Understanding the alarm history and logging — the record of past
alarms — helps diagnose cleared faults and patterns. Understanding the
HMI’s alarm history and logging — the timestamped record of past alarms
— helps you diagnose faults that have already cleared and recognize
patterns in recurring or intermittent problems, so that beyond the
currently active alarms, you can consult the alarm history to see what
alarms have occurred and when, which complements the diagnostics buffer
with an operator-level record of alarm events over time, valuable for
the same reasons the buffer history is: catching what is not present now
and revealing the patterns that point to root causes.
The HMI as a diagnostic ally
Consolidating the HMI material, the HMI is a diagnostic ally — often
giving you the fastest first indication of a fault — and appreciating
this emphasizes using it well. The operator panel, with its alarms and
displays, often tells you about a fault before you even open TIA Portal:
the alarms name the problem, the displays show abnormal values, all
right there at the machine. So the HMI is an ally in diagnosis,
providing a quick first indication that points you toward the problem.
Using it well — reading the alarms and displays first — gives you a head
start, focusing your subsequent investigation. And understanding the
HMI’s relationship to the PLC lets you both use its information (tracing
alarms back to causes) and troubleshoot it (when it misbehaves). So
treating the HMI as a diagnostic ally, and using it well, enhances your
diagnosis. Understanding the HMI as a diagnostic ally — giving a fast
first indication of faults — emphasizes using it well as part of
diagnosis. Understanding the HMI as a diagnostic ally — often giving the
fastest first indication of a fault through its alarms and displays,
right there at the machine — emphasizes using it well as part of
diagnosis, so that you read the HMI’s alarms and displays first for a
head start that points you toward the problem, use its information by
tracing alarms back to their PLC causes, and troubleshoot the HMI itself
when it misbehaves, treating the operator panel not as separate from
your diagnostic work but as an ally that frequently provides the
quickest first indication of what is wrong.